TD_Sequential
Previous  Next

9 and 13 are important numbers for tops and bottoms

This indicator uses Tom DeMark's TD Sequential counting from 1 to ? 13 and more.
Number 9 and 13 usually identify an exhausted trend and mark a trend reversal.
You can choose to display all numbers or only 9 or only 13.
Besides the numbers the text labels are colored based upon the sequence
(Bullish or Bearish)
Enjoy!

You can connect 9s or 13s with a trendline or a drawing tool like Speed Resistance Line, Grid, or Fibonacci Fan...

In order to display more than 100 objects (numbers) go to menu Tools>Settings and change
max number of persistent objects. Also increase bars back in the indicator settings.
Note that increasing number of persistent objects will slow down chart loading. Default is 100.

Tom demark sequential indicator

Basic understanding of DeMark  tom indicator setup

Tom Demark setup is the most renowned among forex traders. Some of the basic setups of DeMark consist of the following,

    The time durations or periods are described in bars. Time could be classified in hourly, daily, weekly or monthly basis. So, a chain of nine uninterrupted bars which are closed upper or lower than the previously closed four bars shows the following setups,

    If these nine consecutive bars close on higher than the previous (prior records) closed four bars, it will be classified as sell setup. If these nine uninterrupted bars close on lower than the previously closed 4 bars, it will be classified as a buy setup.

    Now coming demark trendline strategy on the sell setup, it is called perfect if the length of bars 6 and 7 in the consecutive count are more than the length of bars 8 or 9.

    A buy setup is called perfected if the low of bars in this uninterrupted count is more than the low of bars 8 or 9 likewise the sell setup.

Trading with the TD Sequential Indicator

Less known to the retail trading community, the TD sequential is one of the most interesting Tom demark indicators. It has both a simple and yet compelling interpretation.

In trading, a saying goes that's simple things work best. As such, whenever technical analysis uses simple concepts, traders have more chances to make a profit.

When applied on a chart, the TD sequential plots a bunch of numbers on a chart. Without knowing what the numbers stand for, they seem useless.

TD Sequential

However, a closer look reveals there is a logic behind them. They are not random.

They appear in either an ascending or descending order. And, they start with number one.

An ascending order signals a bullish trend. And, apparently, a descending one signals a bearish trend.

In earnest, the TD sequential brings an interesting technical analysis approach. The key and the number to remember is four!

How come? Four periods turn a bullish or a bearish trend.

Like with any indicator, the usual caveat applies here too. Namely, the bigger the timeframe, the more powerful the implications.
Explaining the TD Sequential Series

It all relates to the closing prices. When a candle reverses and closes above the closing price of the candle four periods ago, the bearish trend ends.

And, the new candle will have the number 1 on top of it. A potential bullish trend started.

As long as no candle that follows doesn't close below the closing price of the candle four periods ago, the bullish trend continues. When a candle does that, the bullish trend ends.

Sounds complicated? It isn't!

Here's an example. The blue numbers in the TD sequential indicator show a bullish trend, while the red ones a bearish trend.

When any given candle closes beyond the closing price of the previous fourth candle, the sequence changes. Hence, an ascending sequence follows a descending one. And, the opposite forms after a bullish trend.

See the shape of the chart above? It shows a strong, bullish, green candle that closes above the previous eight candles closing price.

That's when a new sequence starts. A bullish one.

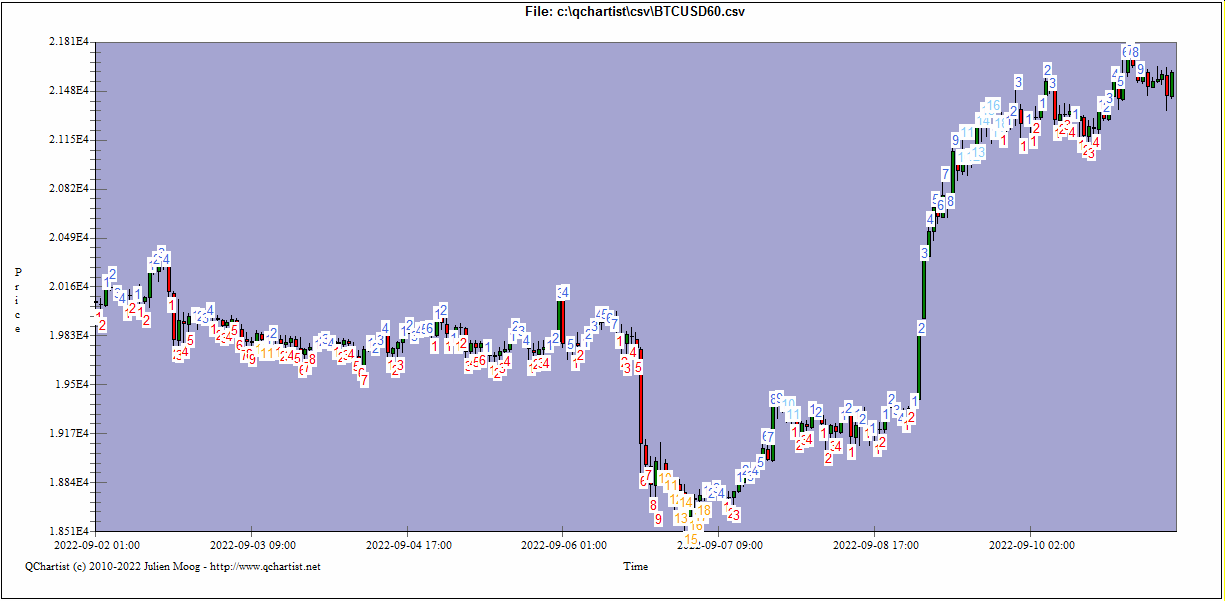
The numbers keep rising with the trend: 1,2,3,4,5,6,7,8, and so on. When the number 9 comes, that's where the focus is.

One of the dominant things of using Demark indicators is their reversal strength. In this case, the technical analysis with the TD sequential indicator shows both trending and reversal conditions.

When the indicator plots the number 9, it means the series/sequence has nine consecutive candles that respect the indicator's rule. If this happens, a pullback is in the cards. Traders look to fade the move.

But, even currencies don't trend all the time. As such, not always the price has the power to print nine candles in a row to respect the technical analysis rules set by Demark analysis.

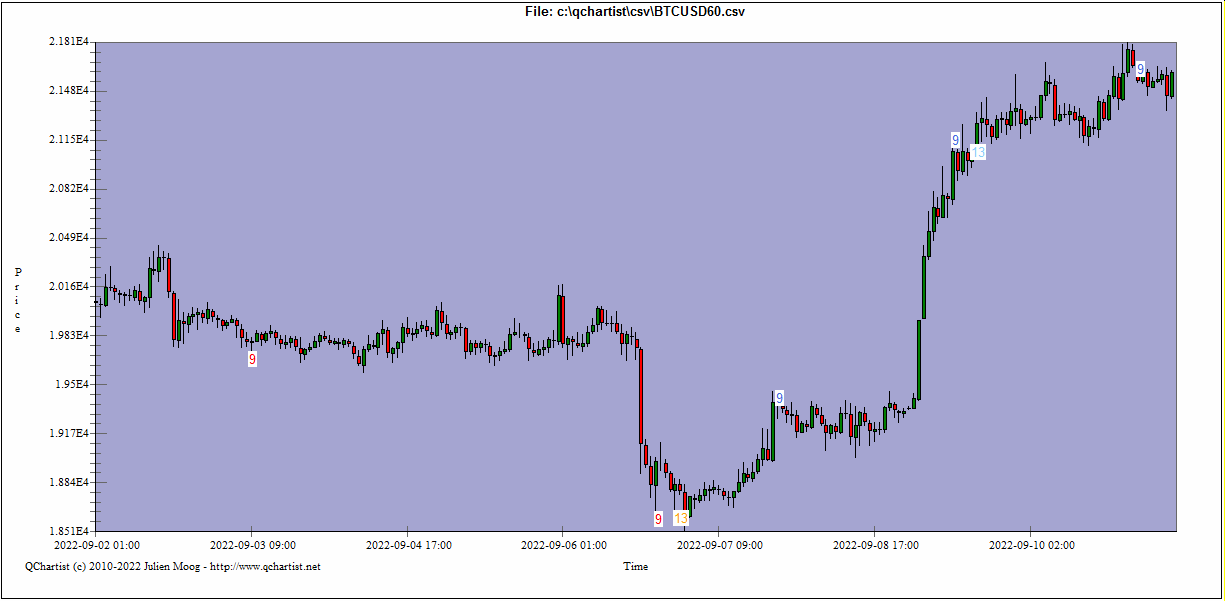
Signals with TD Sequential

A bullish sequence looks exhausted after nine consecutive candles close above the previous fourth candle's close. When this happens, the indicator highlights the number 9 with a bigger font.

The aim is to draw traders attention to it. Reversal conditions exist, so the bulls just received a warning.

In a bearish trend, the numbering appears below the candlesticks. But, the interpretation remains the same.

However, substantial trends see the counting going well beyond the ninth candle. Yet, even strong trends have meaningful pullbacks.

And, this is what this indicator signals. A pullback. Nothing else.

Judging by the sequence, the indicator fits more scalpers and swing traders, rather than investors. Traders looking for quick profits on short-term moves will love it.

graphic
graphic