2022-05-23:
- It is now possible to lock the Price-Time Relationship
You can lock the scale ratio, this allows you to set an explicit
relationship between the price axis and the time axis
In order to do that, open a chart, click on axis type combo
and choose "Fixed price axis scale"
Go in the menu Tools > Settings and change the value of
"lock price scale ratio at:"
Choose a number of bars to display and click 2 times on "OK" button or
re-choose "Fixed price axis scale" axis type
This new functionality is useful for certain drawing tools like:
Triangles, Circles, Squares, arc, ellipses, spirals ...
It works great when you put multiples of 10 or proportional numbers between
the number of displayed bars and the "Lock price scale ratio" and
the drawing tool settings
Enjoy!
More explanations and a screen capture example below:
You can lock the scale ratio, this allows you to set an explicit relationship between the price
axis and the time axis.
In order to do that, open a chart, click on axis type combo and choose "Fixed price axis scale"
Then go in the menu Tools > Settings and change the value of "lock price scale ratio at:"
Then choose a number of bars to display and click 2 times on "OK" button or re-choose "Fixed
price axis scale" axis type
This new functionality is useful for certain drawing tools like:
Triangles, Circles, Squares, arc, ellipses, spirals ...
It works great when you put multiples of 10 or proportional numbers between the number of
displayed bars and the "Lock price scale ratio" and the drawing tool settings ..
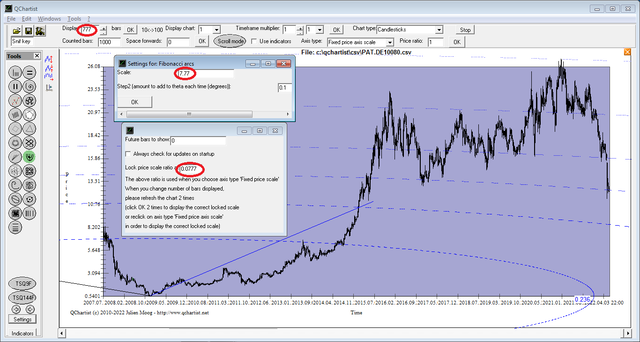
Example of use and parameters with the Fibo arc drawing tool for a weekly stock chart:
This is quite amazing
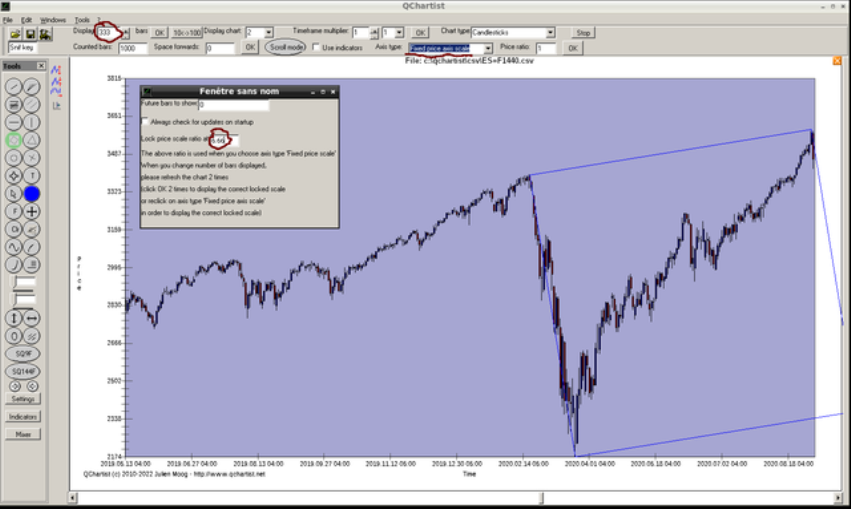
Another example on US Index SP500 Daily:
Drawing tool: Square
Shows with and without the Lock Price-Time Relationship feature.
The two charts have 333 bars displayed on screen.
With:
(Lock price scale ratio at: 6.66 (=333 bars/100*2)
Display: 333 bars)
You can see we always use multiples of 10 and/or proportional numbers.
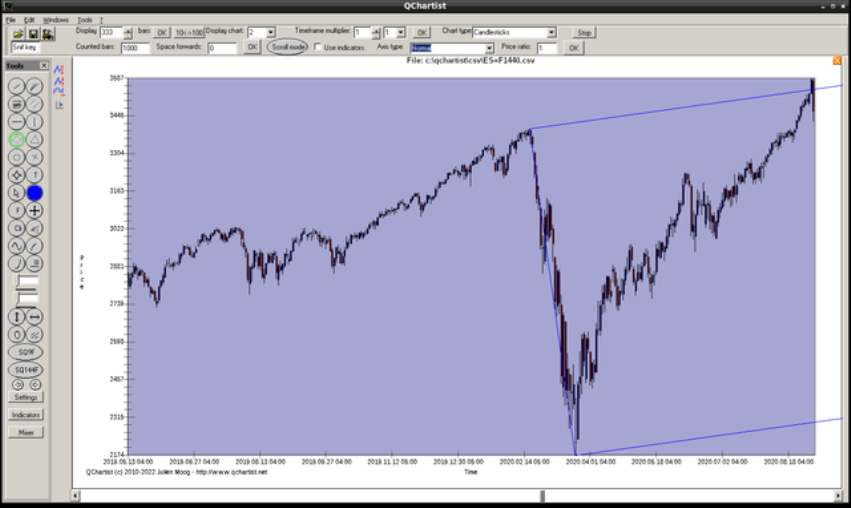
Without the Lock price scale ratio feature:
(Just display: 333 bars)
Here are some good sources of information in order to understand price and time
relationships:
https://www.bullcharts.com.au/Downloads/Understanding%20Price%20Time%20Relationships.pdf
https://www.tradingview.com/blog/en/scale-ratio-now-available-tradingview-5998/
Many thanks to the authors of the articles.
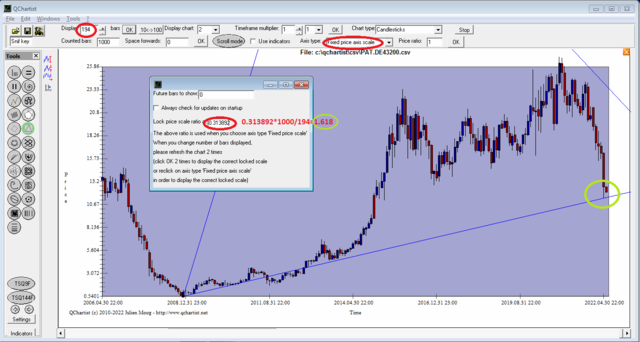
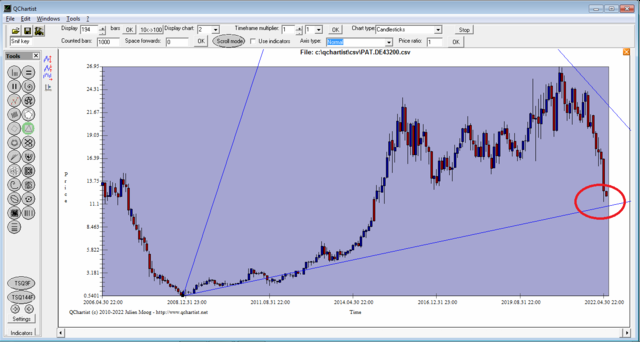
Another example with an actual chart of a Real Estate company:
Same stock chart Monthly With Price Time Relationship (Equi Triangle same center):
194 bars displayed ;
I choosed a value of 0.313892 for the Lock price scale ratio
because 0.313892*1000/194 bars=1.618 (the Golden ratio)
Same stock chart Monthly Without Price Time Relationship (Same Equi Triangle same
center):
194 bars too