- Run QChartist
- We open a chart in "data source", for example "ES=F" (=
SP500 futures) symbol, Weekly TF
- We add the "TD_Sequential" indicator
- When we see a "9", we draw an horizontal line which will be
an important support/resistance
for the future.
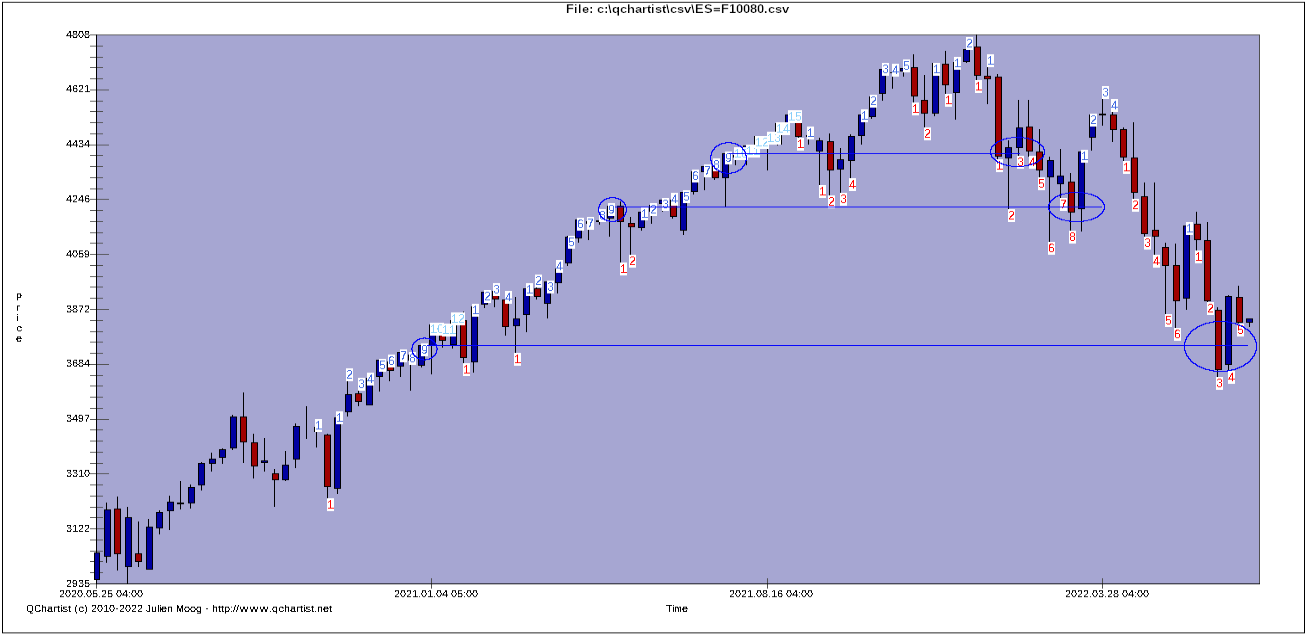
Just look at the example pictures to better understand:
SPX index Weekly - TD Sequential indicator - when we see a "9"
= we draw an horizontal line for future support/resistance:
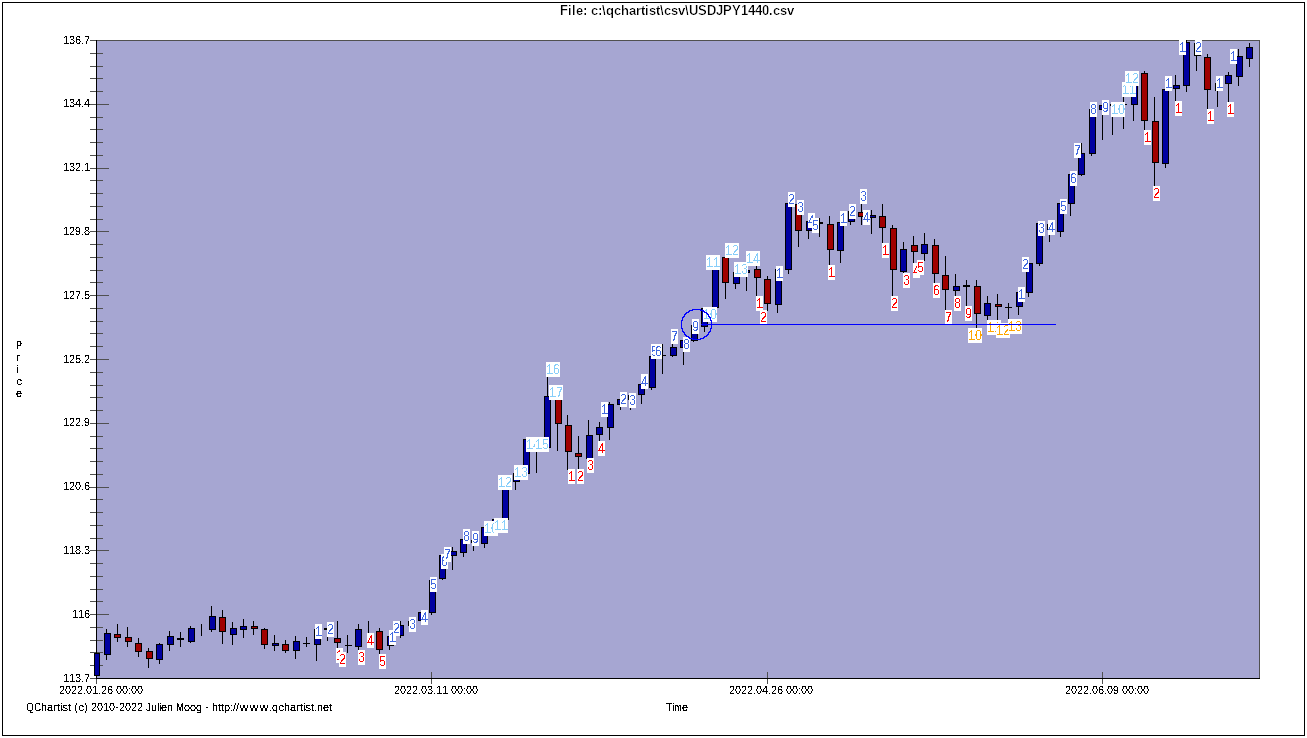
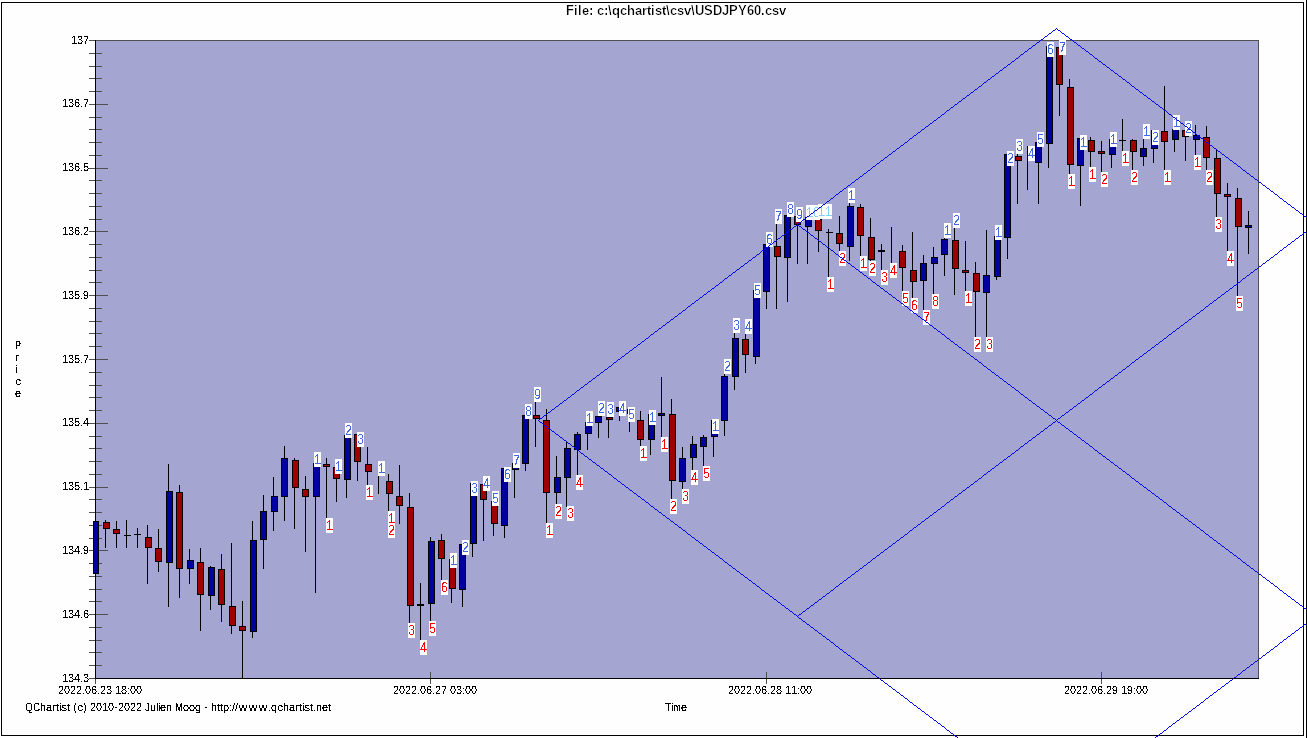
USDJPY FX Daily - TD Sequential indicator - when we see a "9"
= we draw an horizontal line for future support/resistance:
Simple and powerful technique!
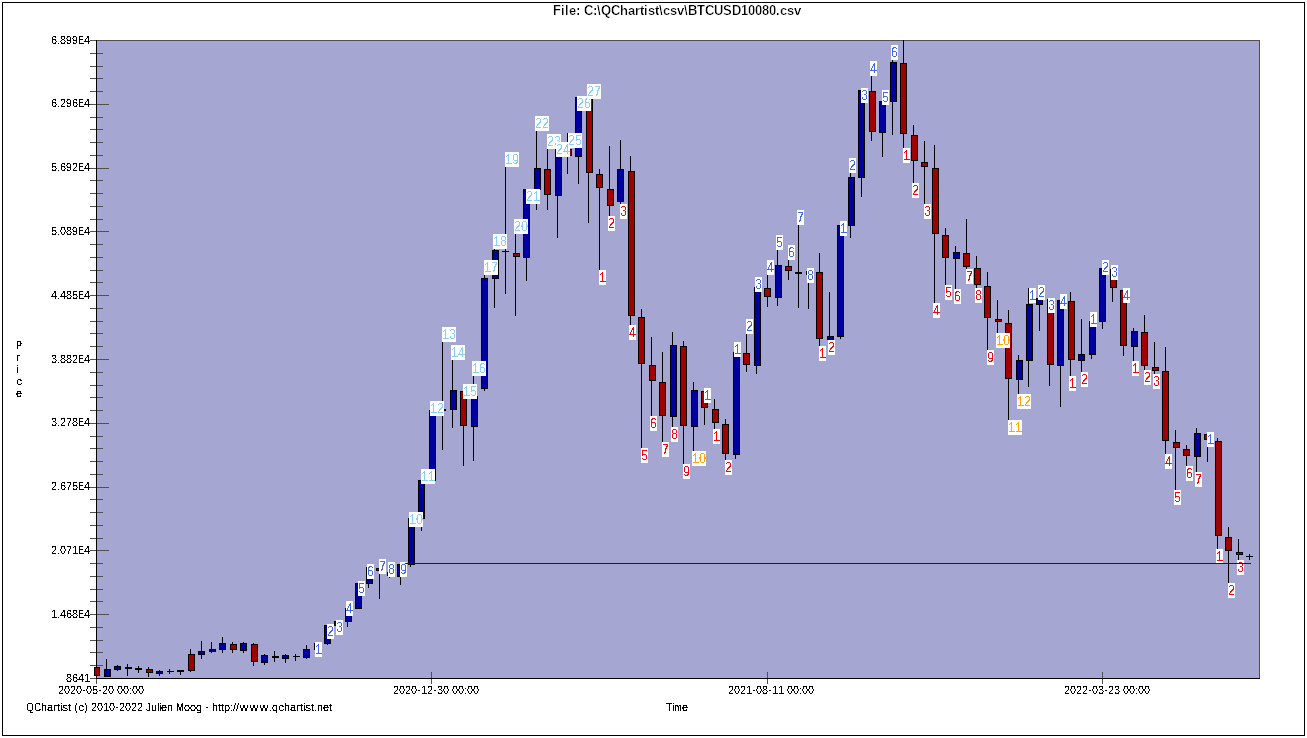
BTCUSD Bitcoin Crypto Weekly - TD Sequential indicator - when
we see a "9" = we draw an horizontal line for future
support/resistance:
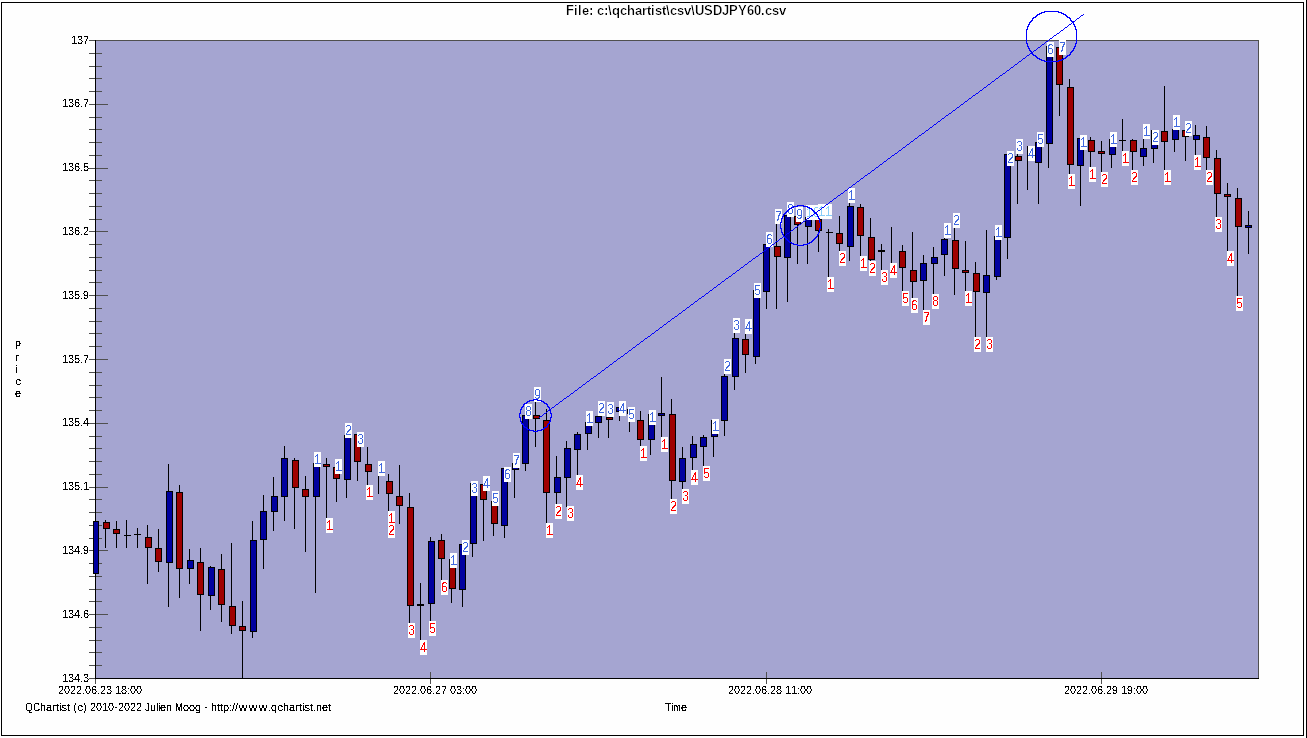
You can also use the TD Sequential indicator with trendlines
and/or grids
- where we see "9"s = we draw a trendline or a grid which will
act as a future support/resistance
Examples: