The position of planets moving along
the Ecliptic as seen from the Earth is measured in the geocentric
ecliptic system in degrees of longitude on a scale from 0 to 360°
Through harmonic multiples of such scales planetary prices can be
derived and planetary lines can be drawn describing
the movement of planets along the ecliptic through
time. Choosing the proper multiples it is possible to compare
stock prices with planetary prices, although the concept may sound
difficult to be grasped and the reason to compare planetary prices with
stock prices may seem hard to be understood, it can be shown that very
often, choosing the proper harmonic multiples, stock prices seem to
resonate when crossing planetary prices. This, in short is the concept
behind drawing planetary lines on stock charts. The first man to have
this intuition was W.D. Gann, now planetary trading lines are a
fundamental tool for any serious astro researcher or astro traders. They
can be drawn on daily and intrady charts and with some experience thay
can help the expert astro trader in his timing decision. Some commercial
packages are available with planetary tolls that can draw these lines
but they are very expensive and most of the time difficult to be used
and configured accordingly to one's own preferences.
To
those who want to learn what planetary lines are in more detail and
also want to learn how to use them, we suggest to first read our book "Wall Street Watchman" .
Google
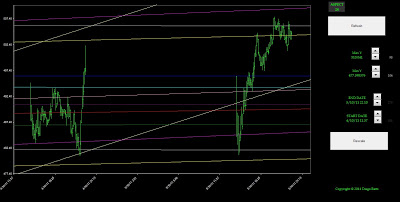
(GOOG) 5 minutes bars chart with 24° planetary lines Multiplier applied
to GOOG price in this case equals 1 Have you ever wonder why sometimes
prices gap or move to some prices and then all of the sudden they
reverse course? Most of the times there is a planetary line behind all
this.
Bank
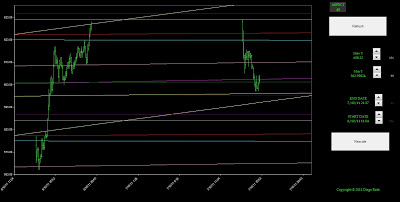
of America (BAC) 5 minutes bars chart with 45° planetary lines
Multiplier applied to BAC price in this case equals 100
German
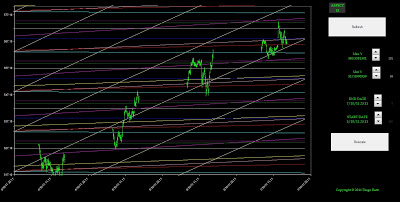
Dax Index (^GDAX) 5 minutes bars chart with 15° planetary lines
Multiplier applied to DAX price in this case equals 0.1
Italian
stock ENI (ENI.MI) 5 minutes bars chart with 45° planetary lines
Multiplier applied to DAX price in this case equals 100
Have
you ever wonder why sometimes prices gap or move to some prices and
then all of the sudden they reverse course? Most of the times there is a
planetary line behind all this. Look at the example below in the
picture sequence of a normal intraday pattern of the Standard
& Poors 500 index opening weak, falling for 10 minutes, touching a
Moon planetary line and all of the sudden rebounding top the next
planetary line...
5 minutes bars in the SPX index
5 minutes bars in the SPX index
5 minutes bars in the SPX index
A
very good trading platform for drawing intraday planetary trading lines
is Wave59: you can use it to draw heliocentric and
geocentric planetary trading lines, set your own conversion factors,
create mirror planetary trading lines and average planetary trading
lines.


