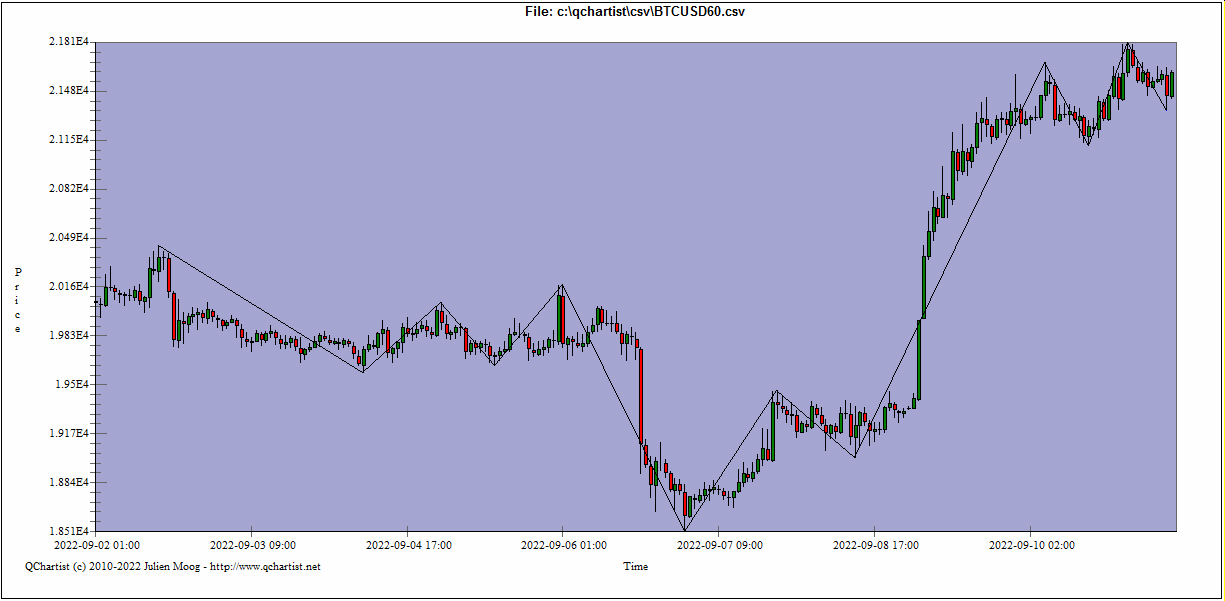
Minimum price change parameter determines the percentage for the price to
move in order to form a new "Zig" or "Zag" line. This indicator eliminates
those changes on the plot we analyze that are less than the given value.
Therefore, the Zigzag reflects significant changes only.
In most cases, we use Zigzag to facilitate the perception of plots as it shows
only the most important changes and turns. You can also reveal Elliot Waves
and various figures on the plot with its aid.