For a nice description, see the "Dynamic Trading Indicators: Winning with
Value Charts and Price Action Profile" book Mark Helweg and David
Stendahl, this book is very good.
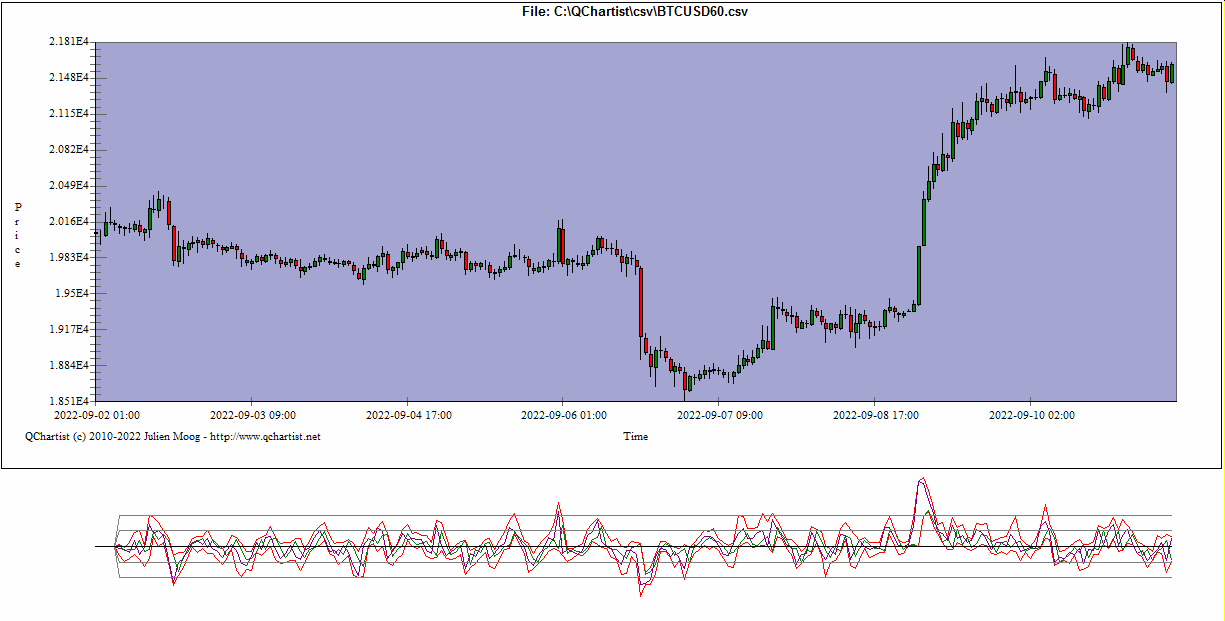
They are usually implemented as candle type charts, but some people plot
the closing values as a line.