Brokers is recommend: Oanda MT4 demo account, JFD Brokers MT4 demo account, FXPro MT4
demo account and eToro real account to operate.
List of MT4 indicators needed:
- Vegas Currency Daily 1 Hour2
- ADR lines Shinigami v1.1
- ADR lines Shinigami v1.12
- ADR lines Shinigami v1.13
- ATR_Channels
- BB - HL (Per=200)
- bowels
- Center of Gravity 1
- Center of Gravity
- fibo
- fibo2
- ftvcprdl
- Ichimoku
- j_tpo
- MA Chanels FiboEnv Mid
- Murrey_Math_MT4_VG
- Past Regression Deviated (LR.length=225)
- Past Regression Deviated Log
- realMACD
- Spectrometr_Separate
- Stepftvcprdl_v2
- StepRSI_v2
- Stochastic (5,3,3)
- StochasticRSI (RSILength=5 ; StocLength=5 ; WMALength=5)
- TD Sequential
- TMA (TimeFrame=60 and 240 ; Interpolate=false)
- TMA+CG (Interpolate=false and all alerts false)
- TSCD
- valuechartatrchannels
- Volatility.Pivot
- VWAP Oscillator
- Weighted WCCI
- SwamiRSI_v1
- ZUP_v66
- WeeklyPivot
- MonthlyPivot
- CoronaTrendVigor_v2.1
- CyAn_1_Fty (lenth=3)
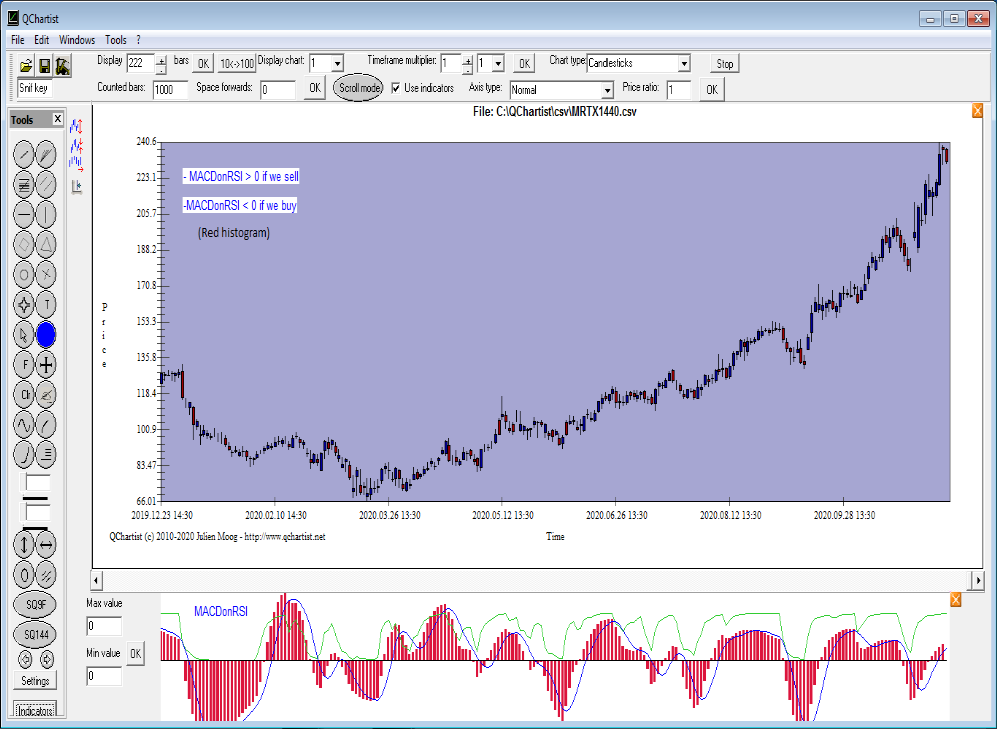
- MACDonRSI
- RD-Combo
- Directional Volume Index (50,50,5)
List of MT4 templates needed:
- !BABON1H
- !PRD_WWCCI
- !system_sync
- !Corona
- 0tmacg
- JM cog
- !MA C W Pivot
- jm adr murrey
- !Channels
Mirrors:
Then copy the .mq4 and .ex4 indicators in MT4 indicators folder
Copy the .tpl templates in MT4 templates folder
Restart your MT4 software.
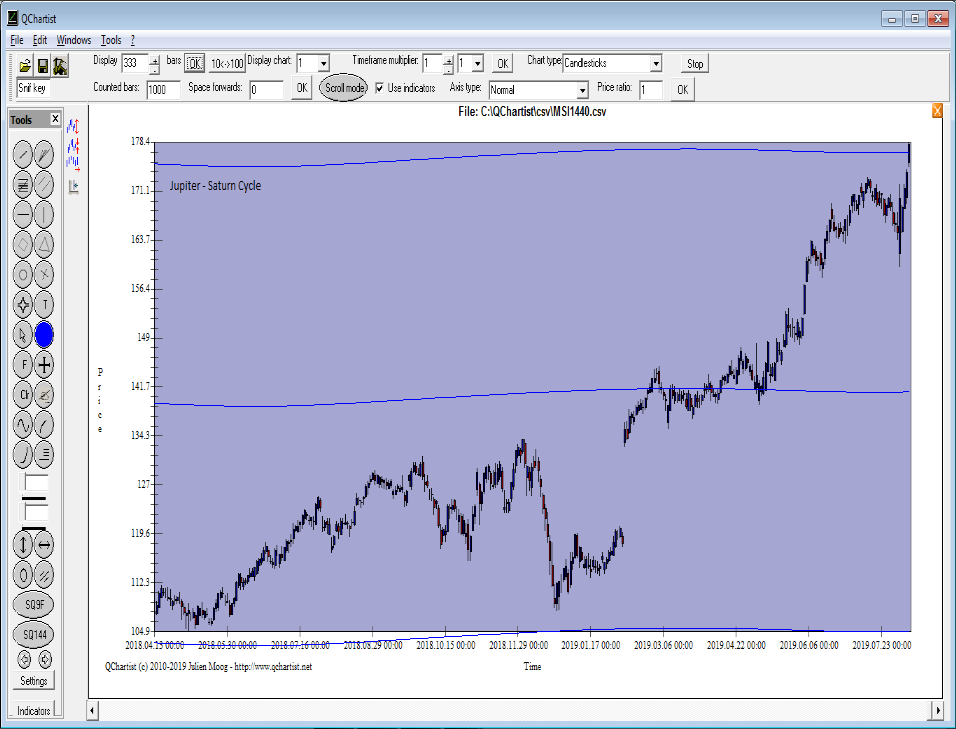
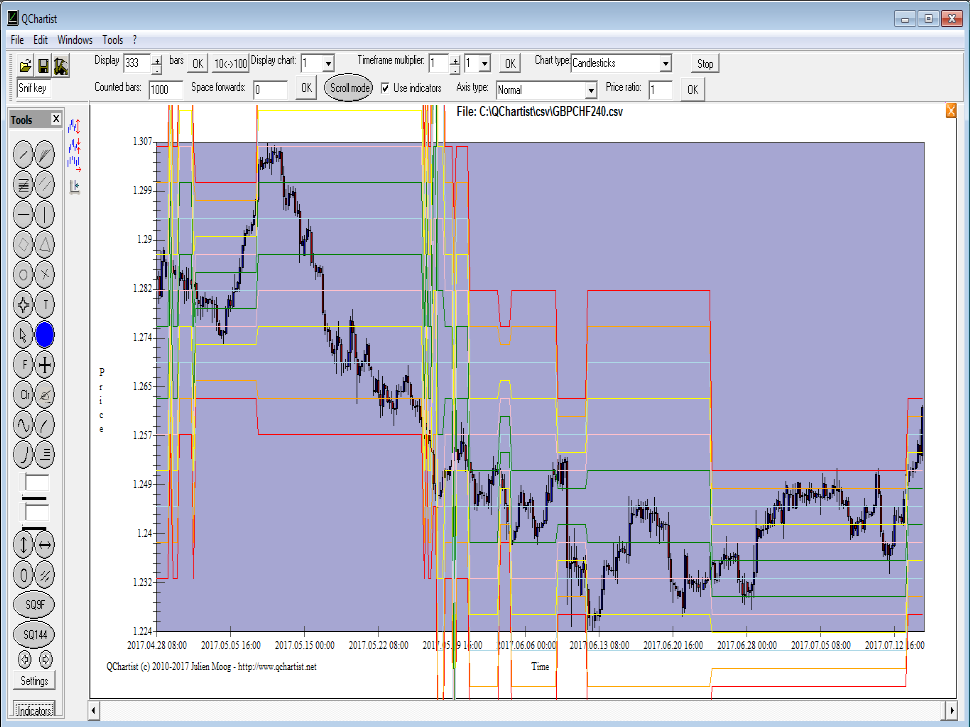
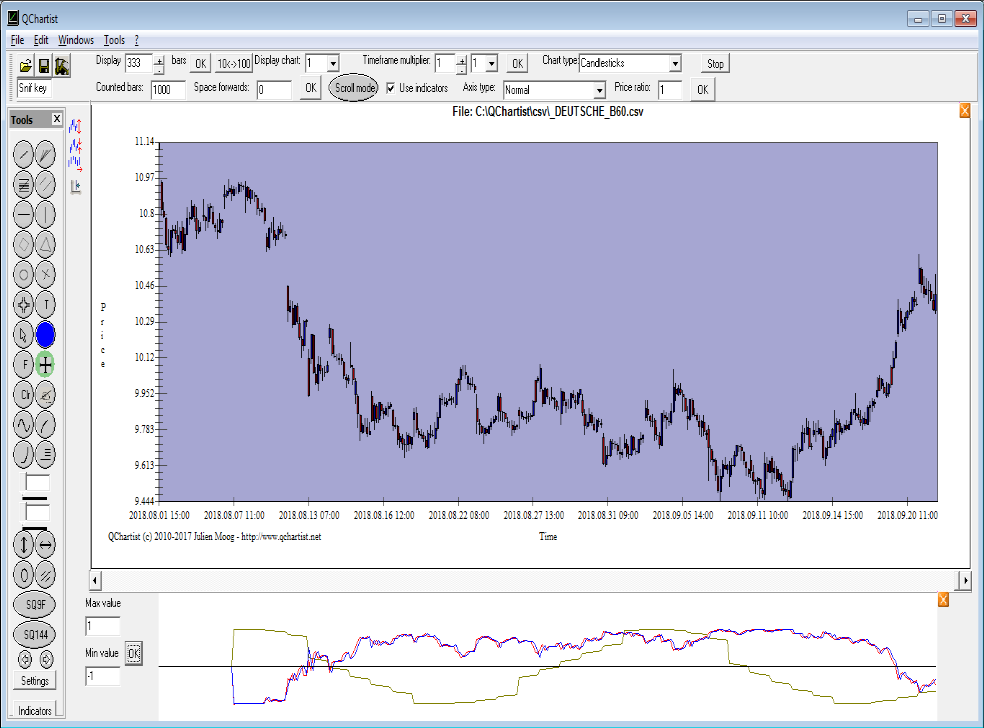
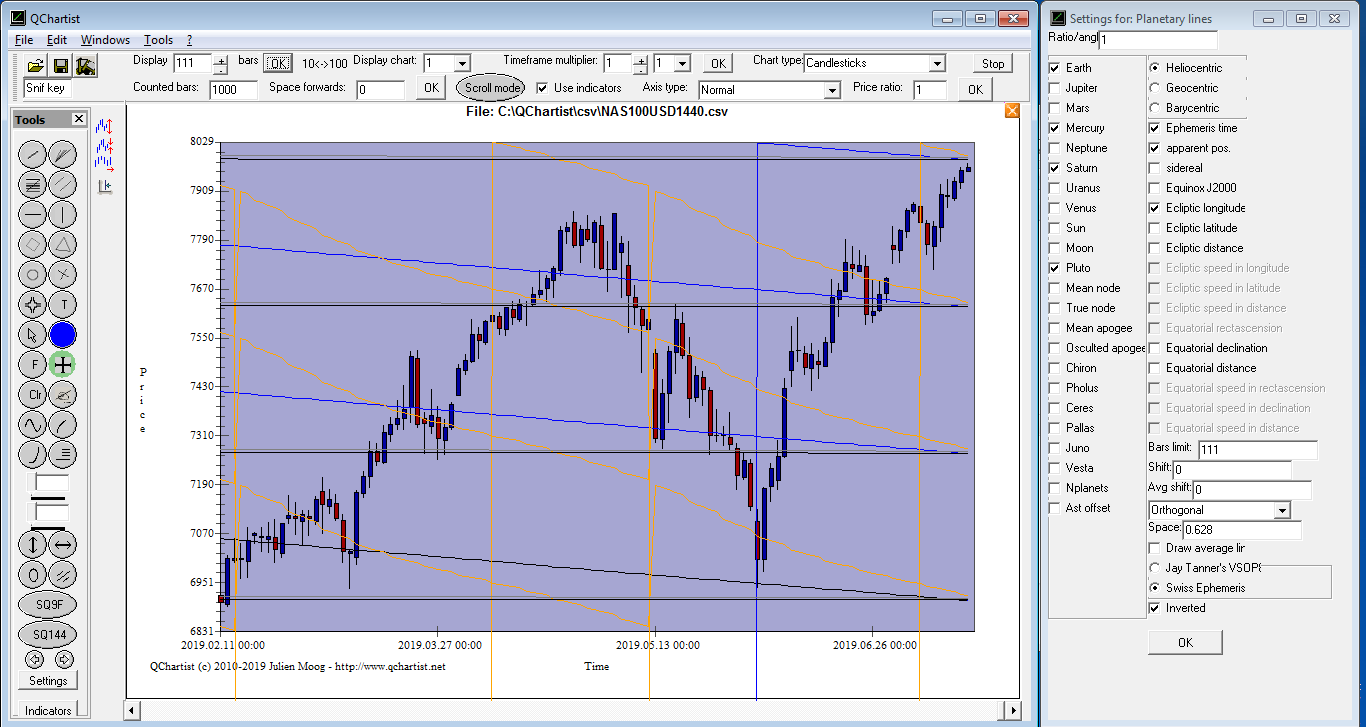
You will also need to use the Jupiter Saturn Cycle + planetary lines + planet scale + planetsqn
indicators available in QChartist software.
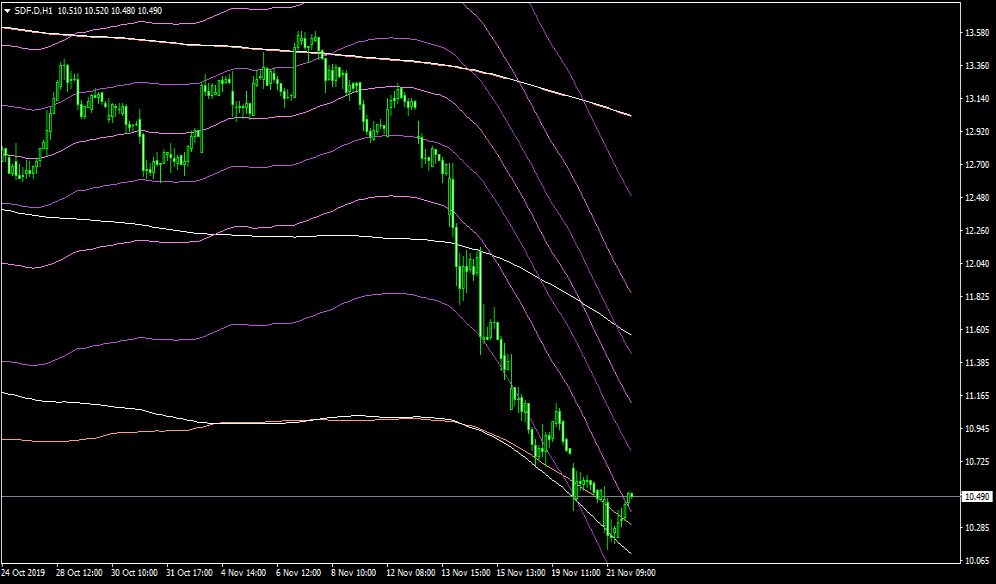
Entry (please use H1 timeframe):
- With template !system_sync: price is on the the Average Daily Range (ADR 1.1) blue marine line
imperatively
- With template !system_sync: price is on the the Average Monthly Range (ADR 1.13) blue marine
line or MonthlyPivot R1-3 or S1-3 (TPL !MA C W Pivot)
- With template !system_sync: price is above the Average Weekly Range (ADR 1.12) yellow line
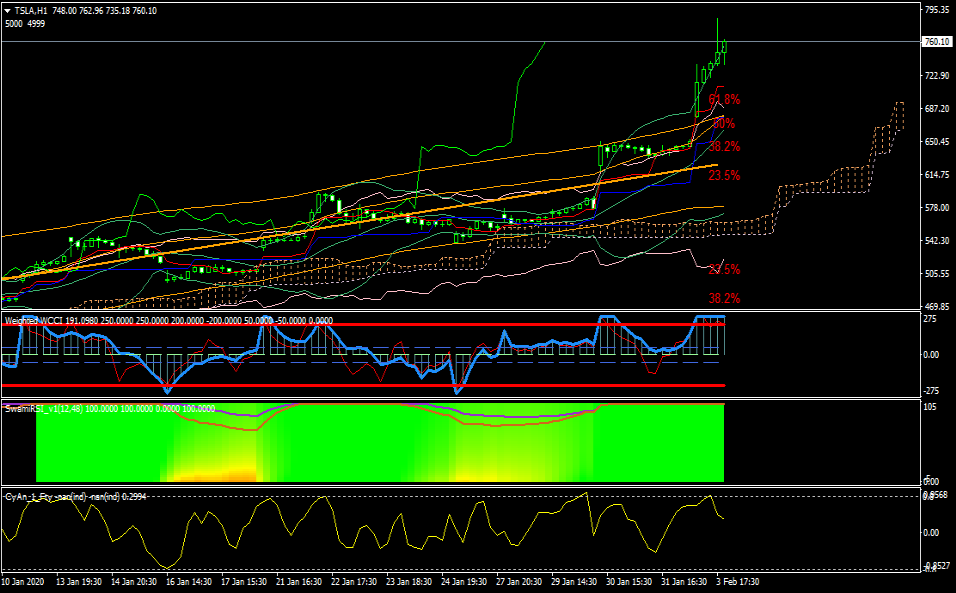
Interesting:
- With template !PRD_WWCCI: price is near past regression deviated (orange) higher band, fibo
(orange) higher band and atr channel (pink) higher band
- With template !PRD_WWCCI: Weighted WCCI blue thick line is on the higher red line
- Ichimoku cloud trend up if we sell, trend down if we buy
- Bollinger Bands on upper or lower band
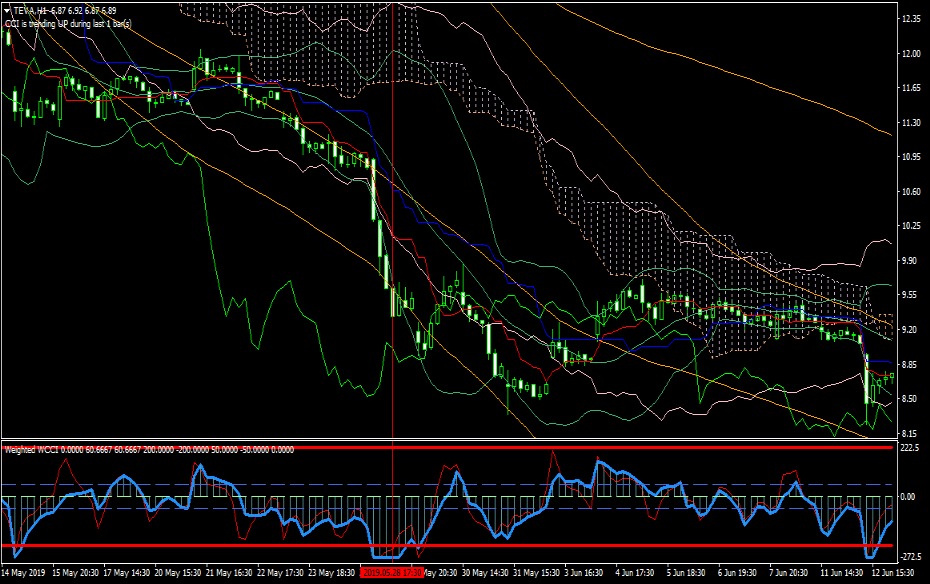
- With template !PRD_WWCCI: SwamiRSI_v1 is stuck on the upside or downside imperatively
- With template !PRD_WWCCI: CyAn_1_Fty is near 0.8 or -0.8
- With template jm adr murrey: price is >= the orange +1/8 Ove orange line of Murrey Math on H1,
H4, Daily, Weekly or Monthly timeframe
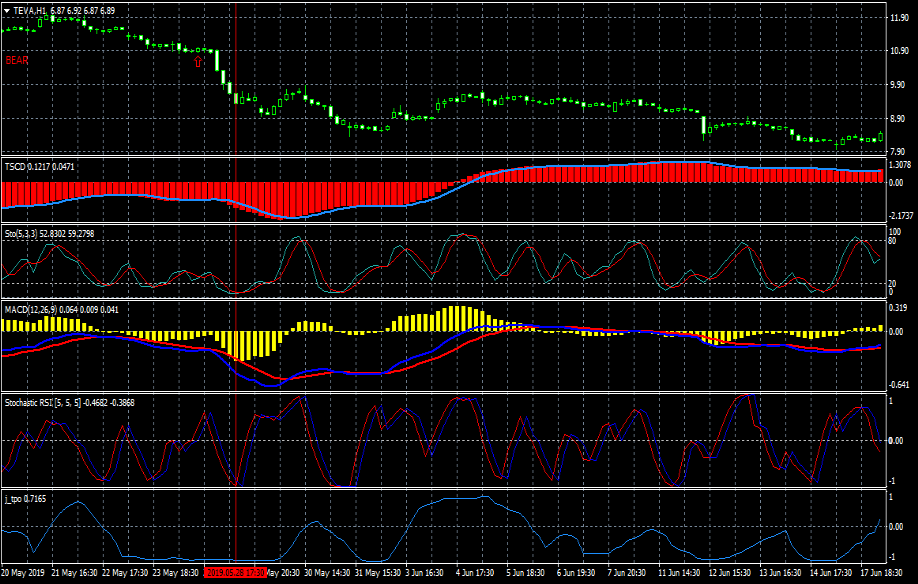
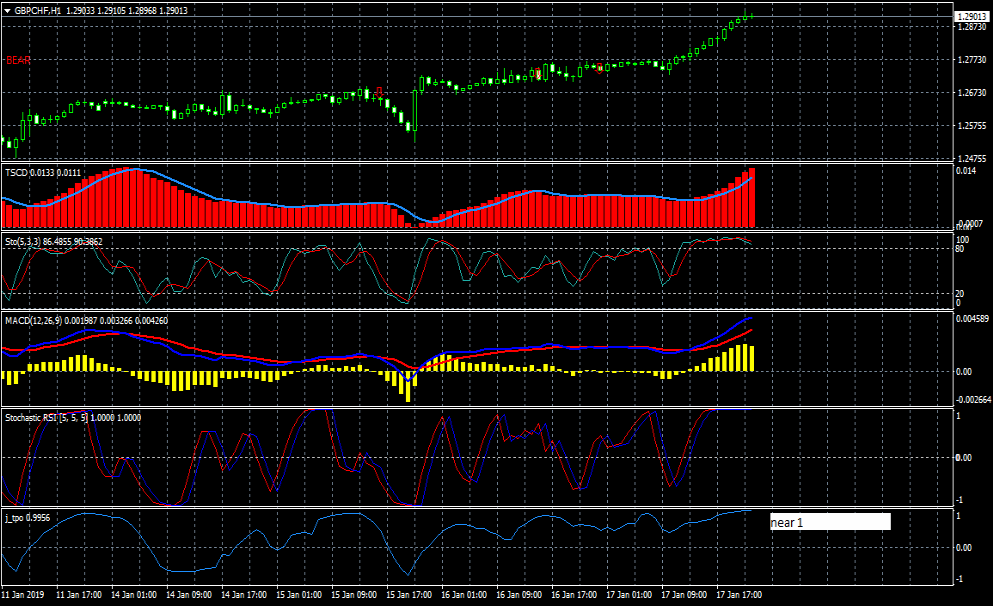
- With template !Corona:
- With template !Corona: TSCD red histogram > < 0
- With template !Corona: Stochastic 5,3,3 near 80
- With template !Corona: RealMACD blue line is at least as high as the yellow histogram
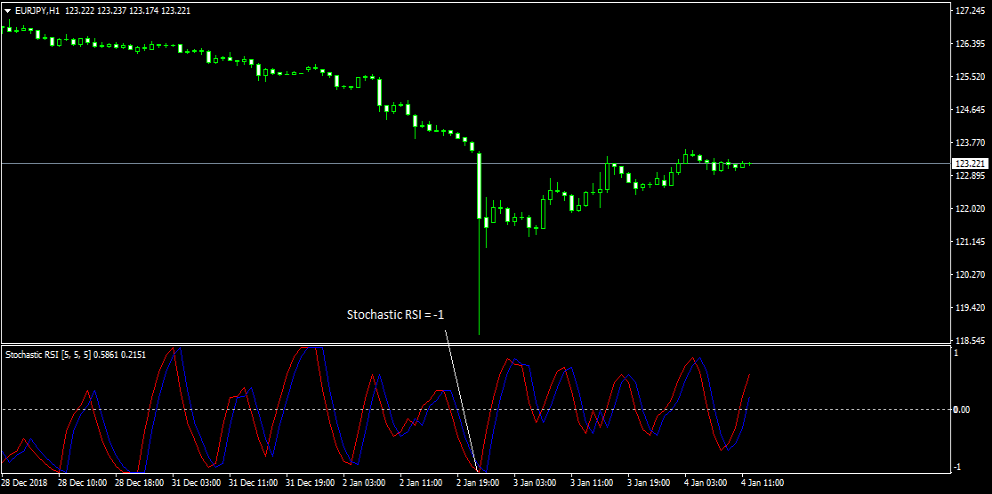
- StochasticRSI is at -1 or 1
- j_tpo > < 0
- One of the 2 sinusoids with the highest amplitude is pointing down (QChartist fftspectro
indicator) (1 hour to monthly TF)
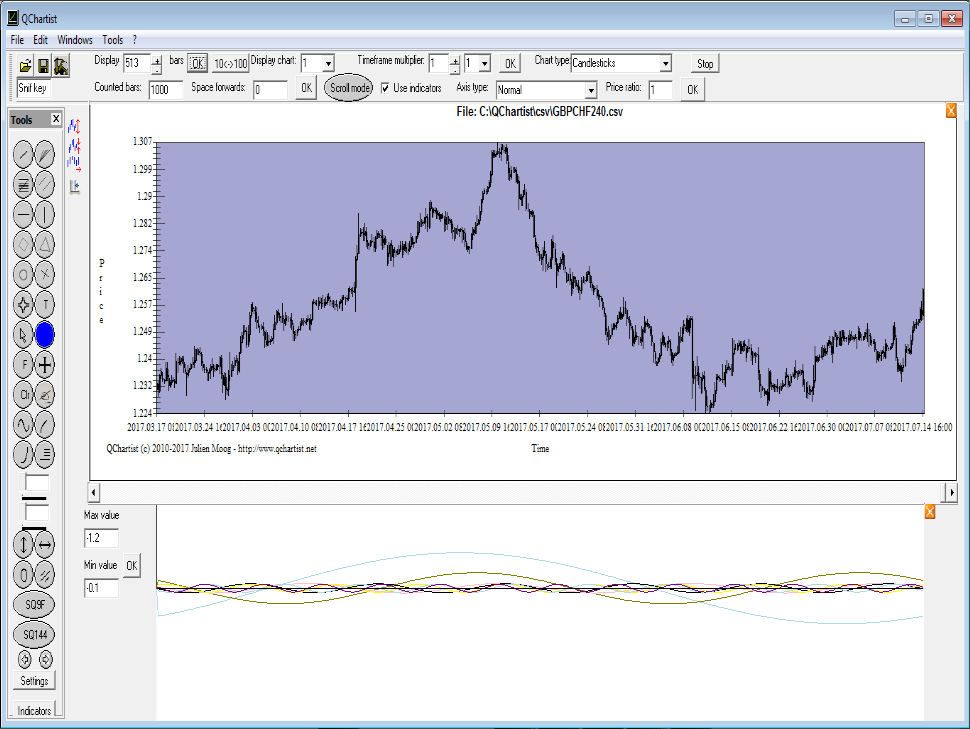
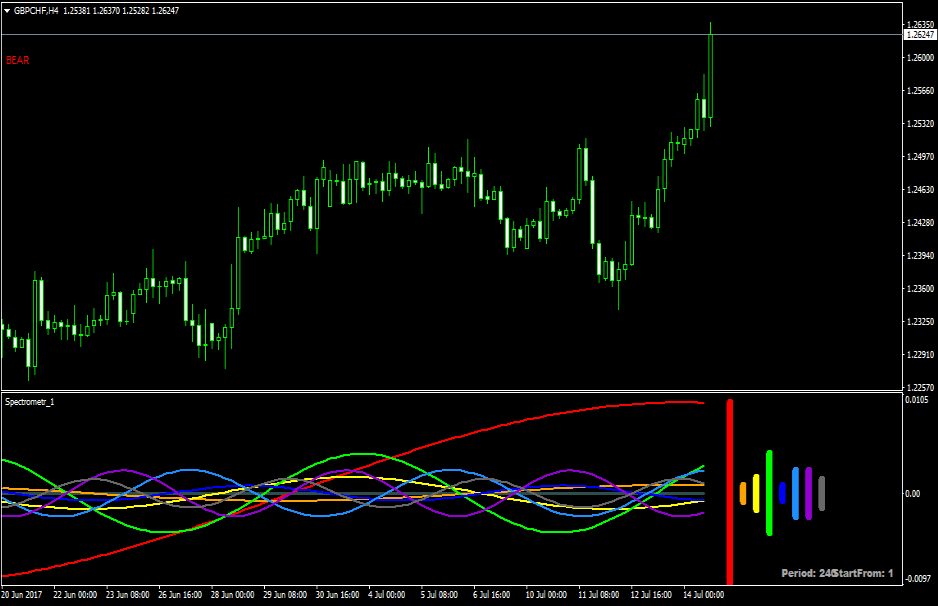
- The sinusoid with the highest amplitude is pointing down (red) (MT4 spectrometer_separate
indicator)
- If sinusoid with the highest amplitude is not pointing down (MT4 spectrometer_separate
indicator) but the 2nd sinusoid with the highest amplitude is pointing down, fftspectro sinusoid with
the highest amplitude must point down.
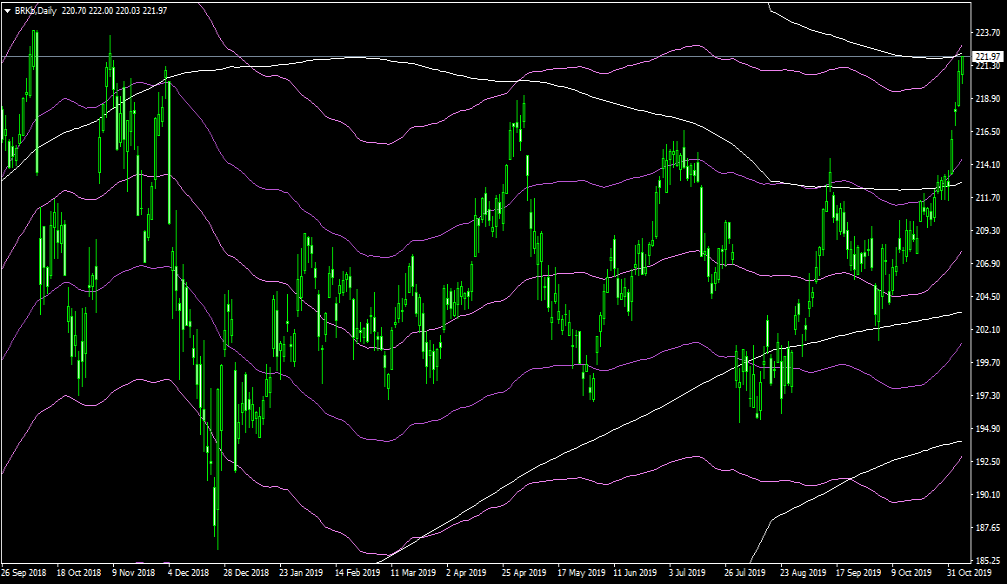
- Optional but advised:
- You should use the Center Of Gravity on TF Daily or Weekly or Monthly to see if the direction of
the trend is OK. (not required)
Don't trade against the trend.
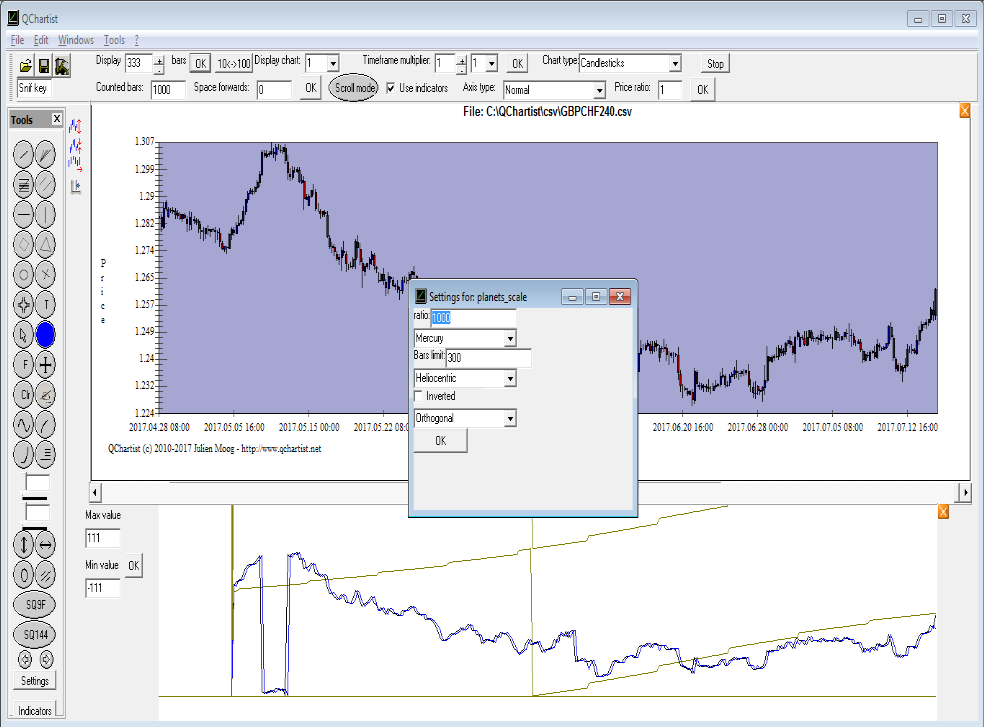
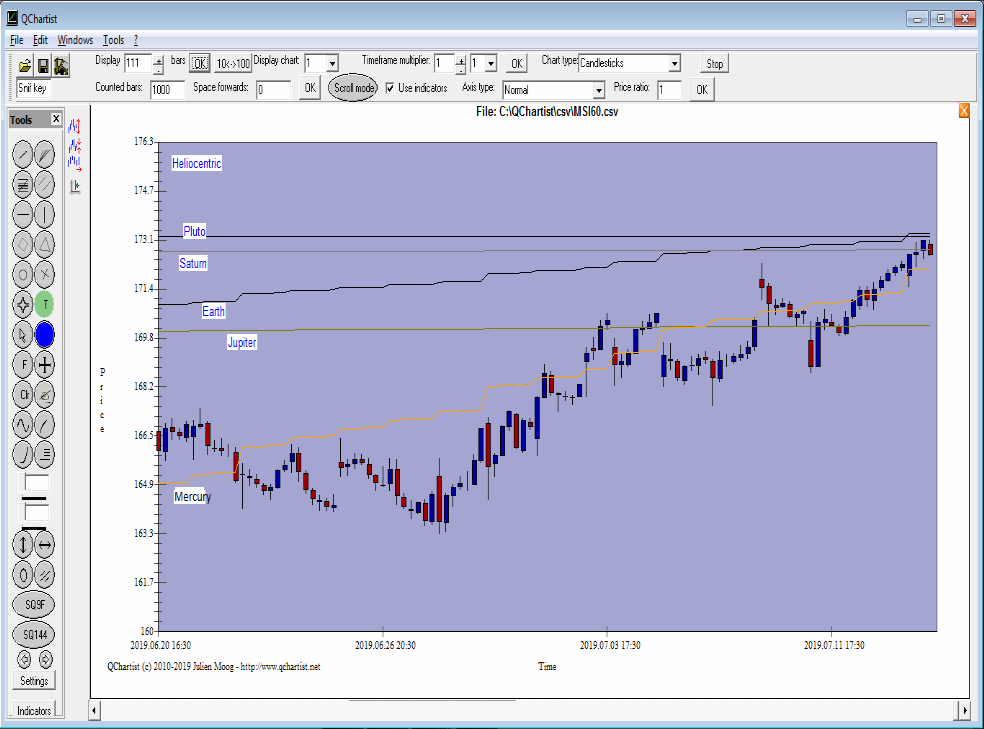
- With the QChartist software: detrended price is near a line of the Mercury or Venus or Earth
indicator (resistance) (planet scale indicator)
If it is not the case, PlanetSqn on Daily TF or Jupiter - Saturn Cycle on Daily TF or Moon Scale on
H1 can do the job.
In order to open the .csv MT4 charts from QChartist, you need to export .csv files from MT4
history center.
- You can also use the TMA indicator to detect tops and bottoms with a timeframe of 240 set in
the indicator settings (not required)
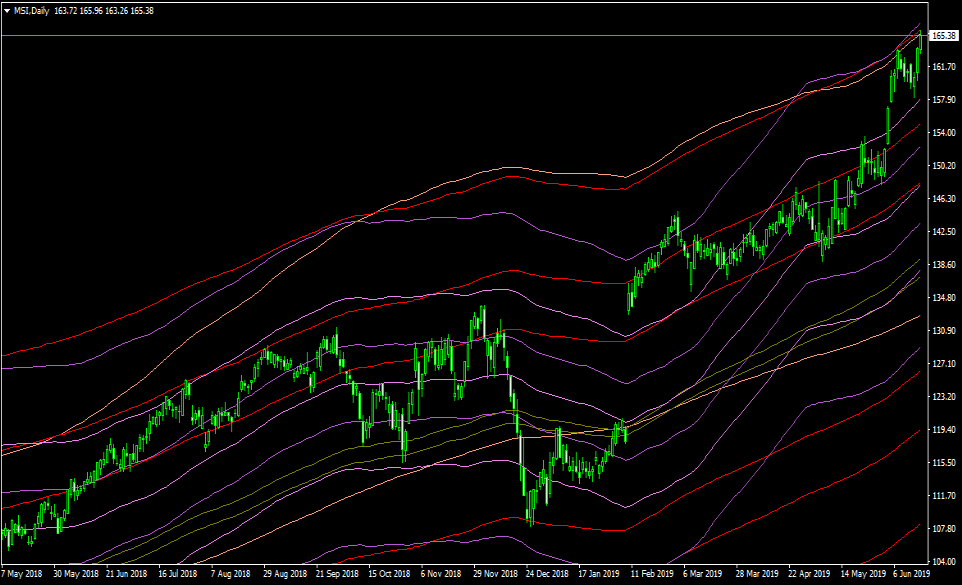
Example:
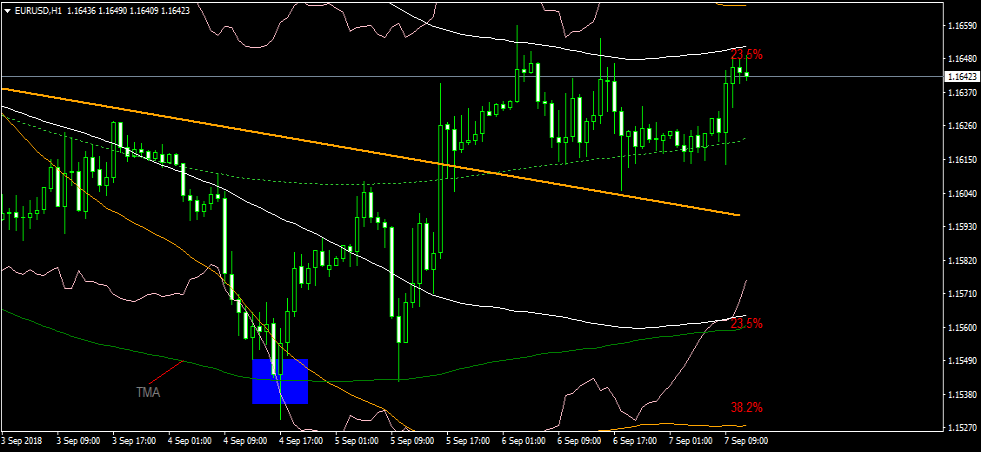
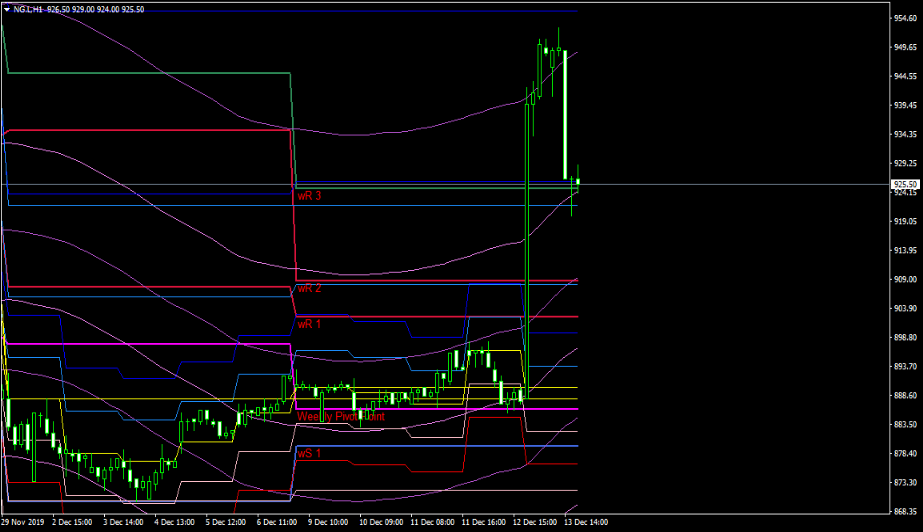
- The blue bottom enveloppe is below the marron bottom enveloppe
- The CoronaTrendVigor_v2.1 indicator is flat
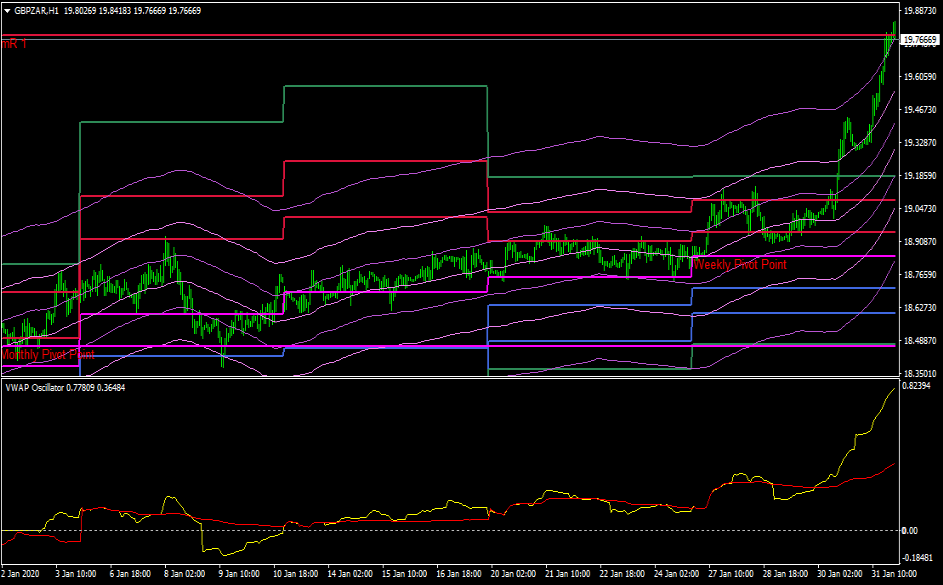
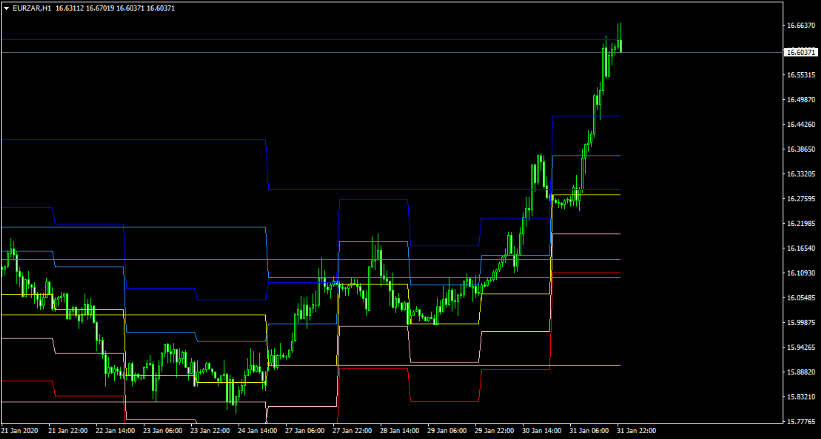
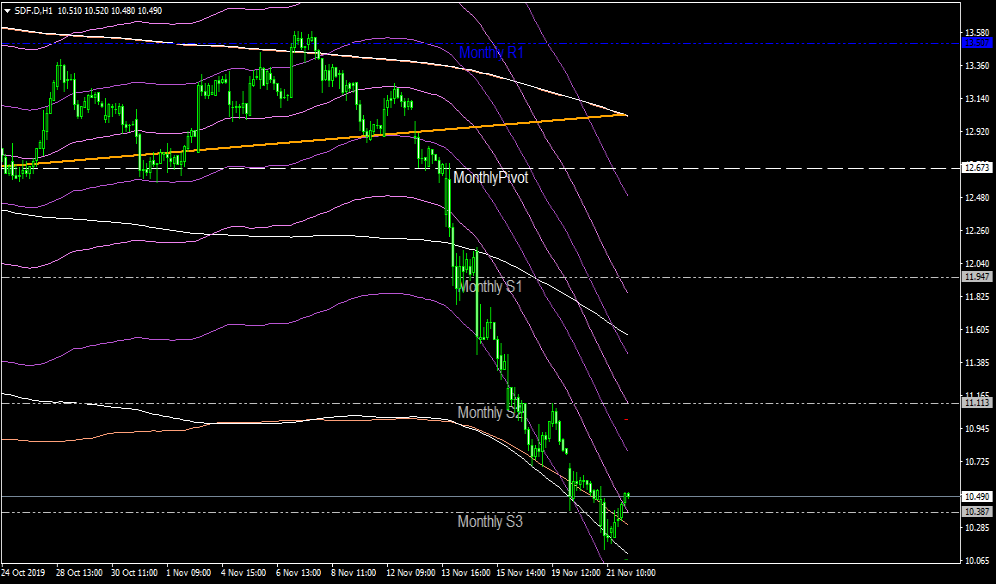
- With TPL !MA C W Pivot We are near the Weekly Resistance 3 for the current week or for the
previous week
- With TPL !MA C W Pivot We are on the MonthlyPivot R1-3 or S1-3 for the current month or on
the Average Monthly Range (ADR 1.13 TPL !system_sync) blue marine line
- Price must be > MonthlyPivot violet line if we sell or price < MonthlyPivot violet line if we buy
- With TPL !MA C W Pivot We are on the last line of MA Chanels FiboEnv Mid imperatively
- With TPL !MA C W Pivot With VWAP Oscillator: the 2 lines are > 0 if we sell or < 0 if we buy
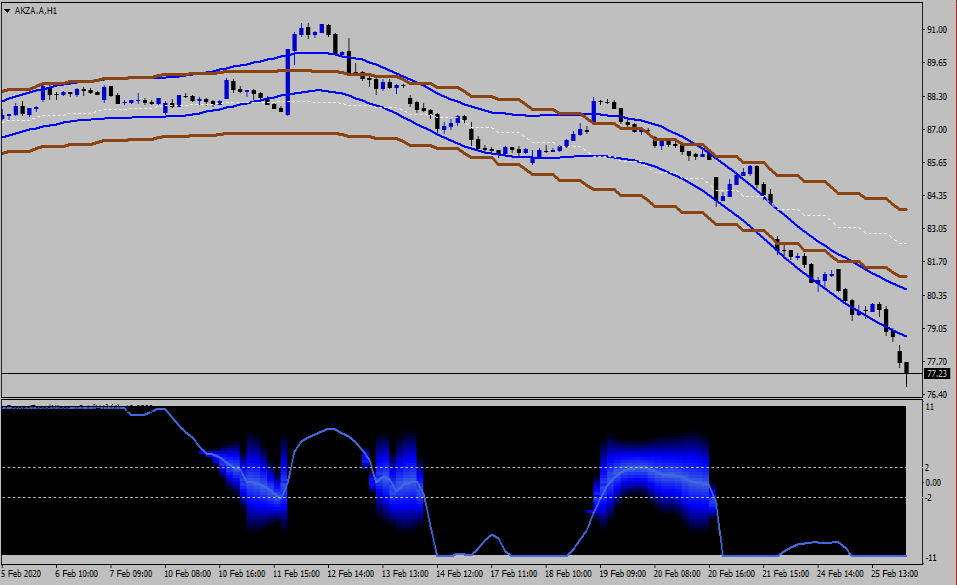
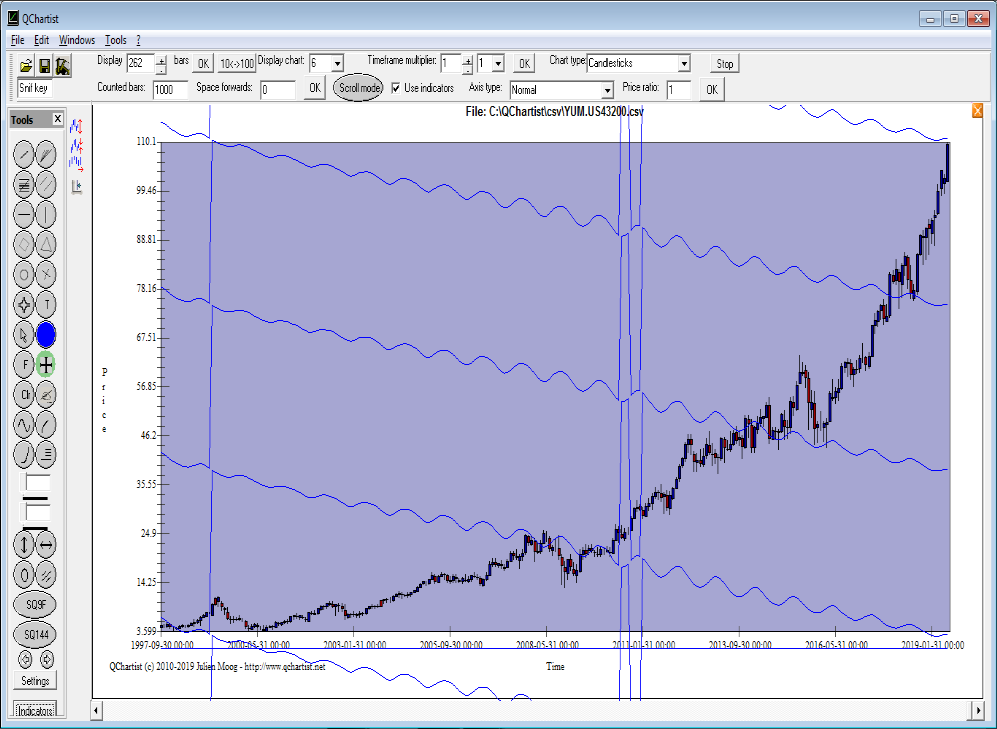
- You can also use BB - HL and Moon Scale to detect tops and bottoms Example:
- With TPL !Channels: we are near the upper or lower band of BB - HL
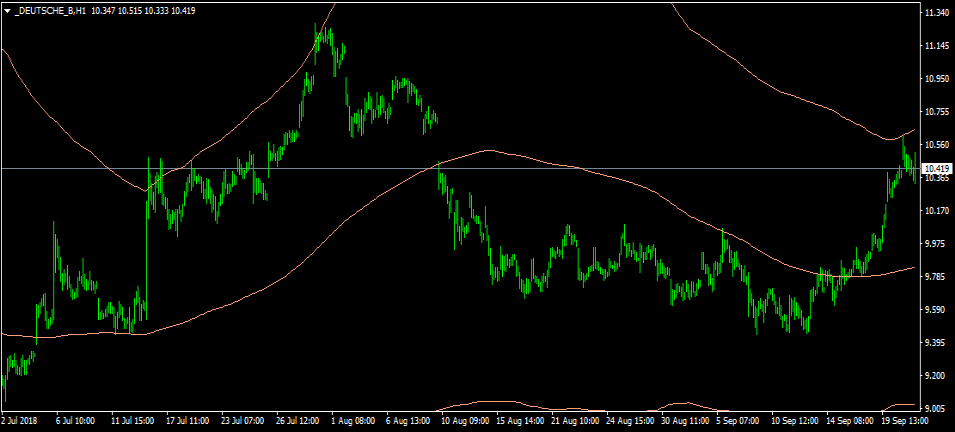
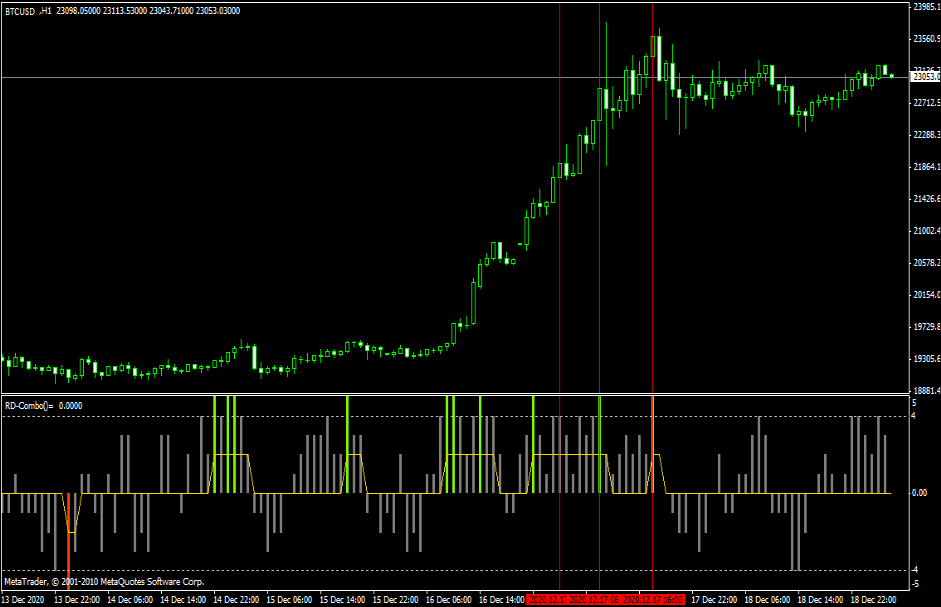
If the price still goes into the wrong direction:
- Wait for a green bar of RD-Combo to enter one more time (highly recommended)
- Look at the 3 bands on daily or weekly charts ( BB - HL , Vegas , MA Chanels FiboEnv Mid)
(Vegas is very useful but we won't use it)
- Look at Jupiter - Saturn Cycle or Planetary Lines Convergence
If the price still goes into the wrong direction:
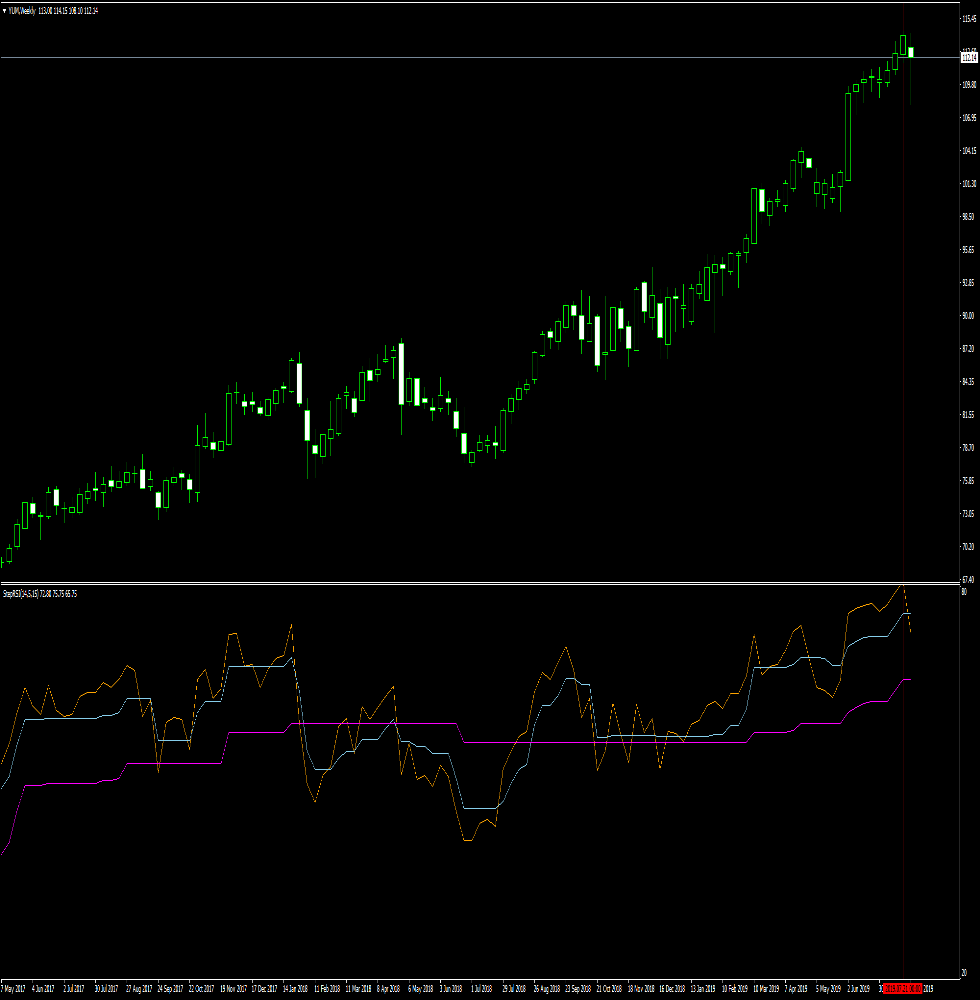
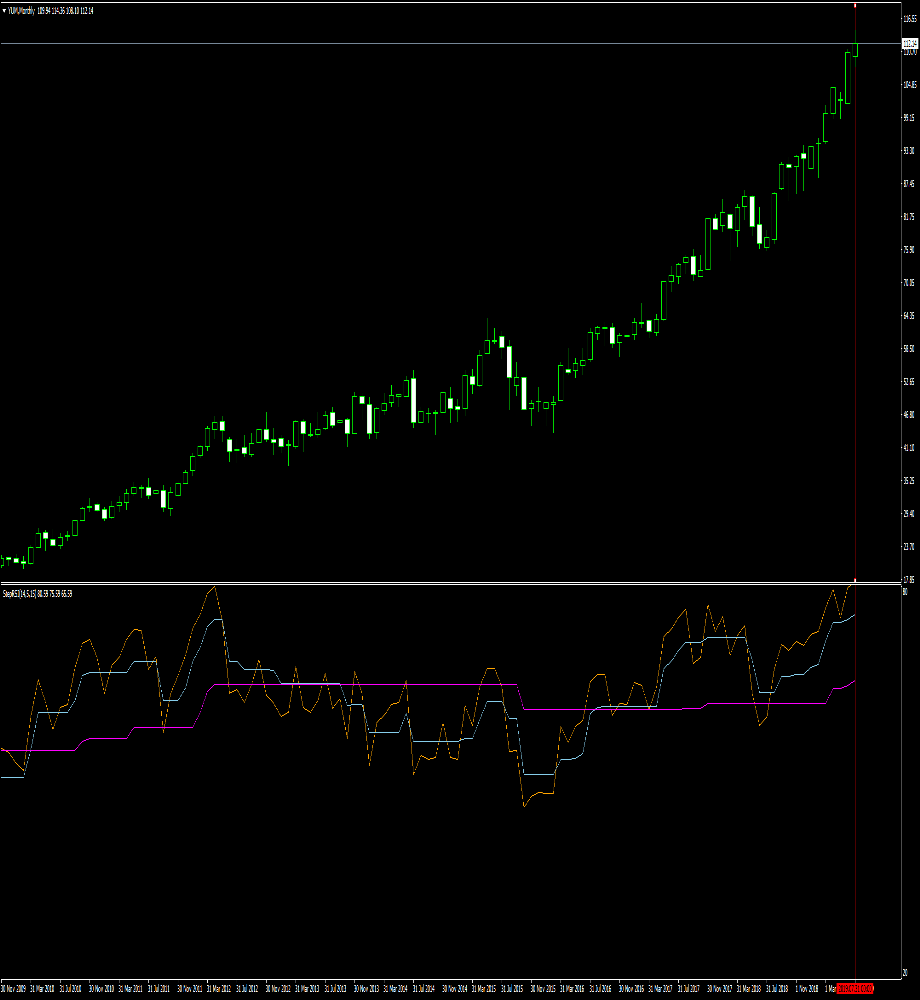
- Look at the previous bar of StepRSI_v2 on the weekly or monthly chart for >80 or <20 (not
required)
If the price still goes into the wrong direction:
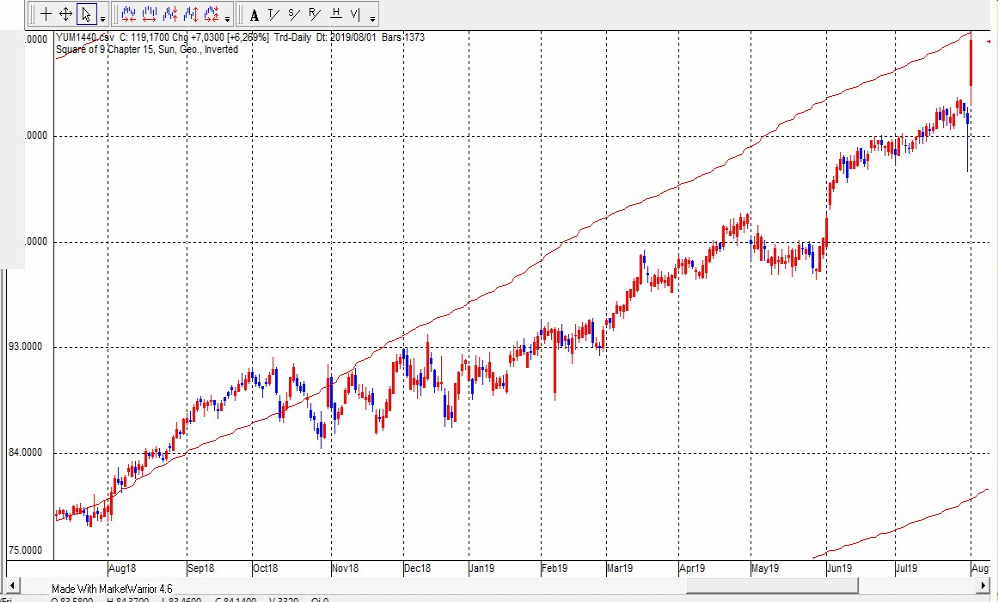
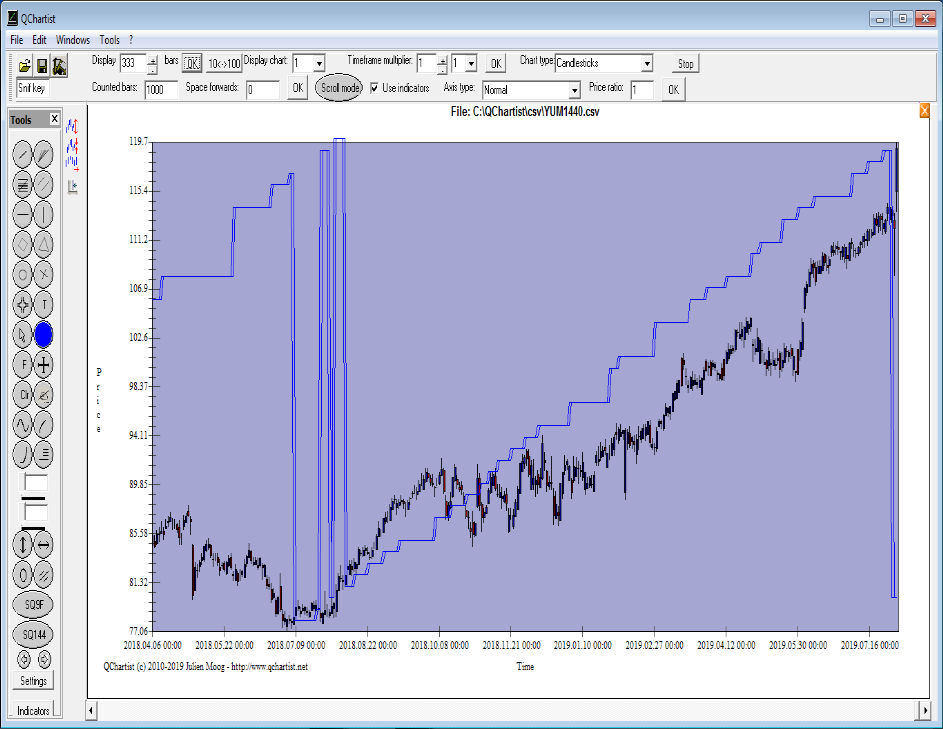
- Look at the Planetsqn indicator (Sq9Chapter15) (required if all other astro indicators are not ok)
on the daily tf with Market Warrior or QChartist
- You can look at Past Regression Deviated Log (not required) with MA Chanels FiboEnv Mid
- You can look at Past Regression Deviated Log with MA Chanels FiboEnv Mid and BB - HL
period 500 (Past Regression Deviated Log not required, BB - HL period 500 not required, but BB -
HL period 200 and MA Chanels FiboEnv Mid highest or lowest band required)
(TPL !Channels)
- You can look at Monthly Pivots Points with indicator bowels (required if RD-Combo is not
enough)
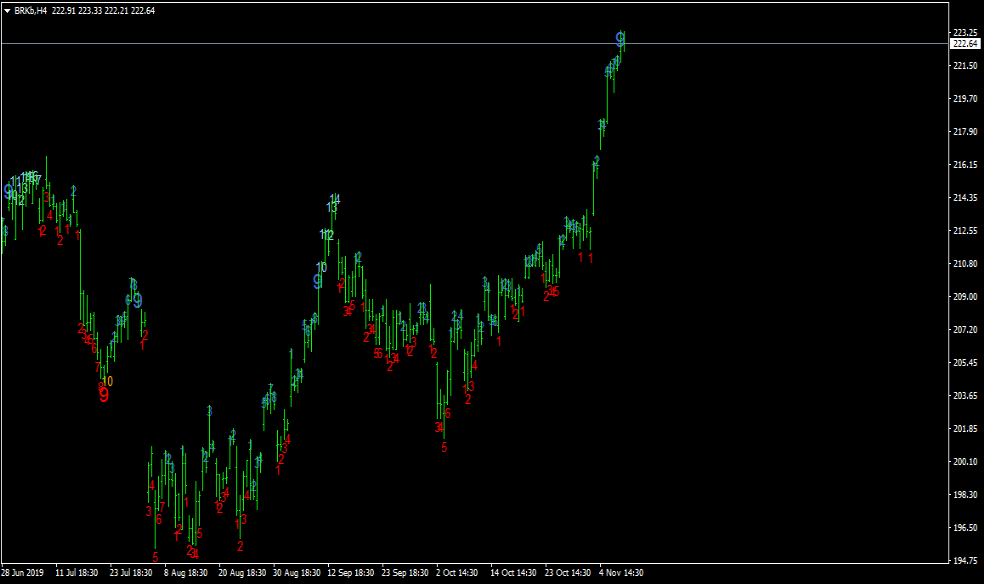
- You can look at TD Sequential if there is a 9 or a 13 (not required)
- You can look at ValueChartATRChannels with Fibo Fans and Pitchforks (not required)
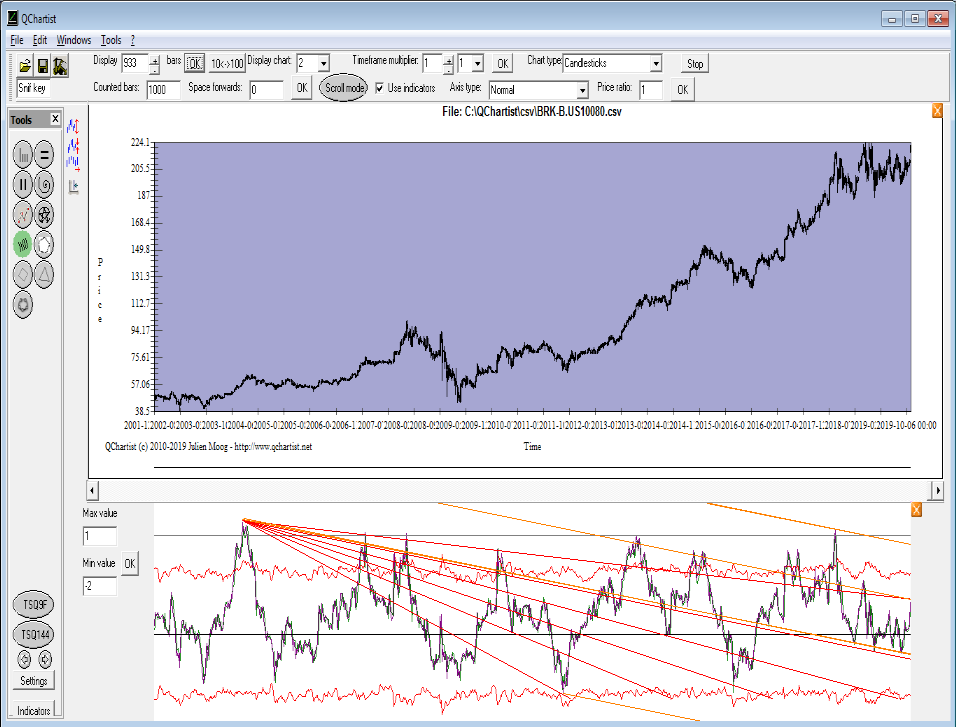
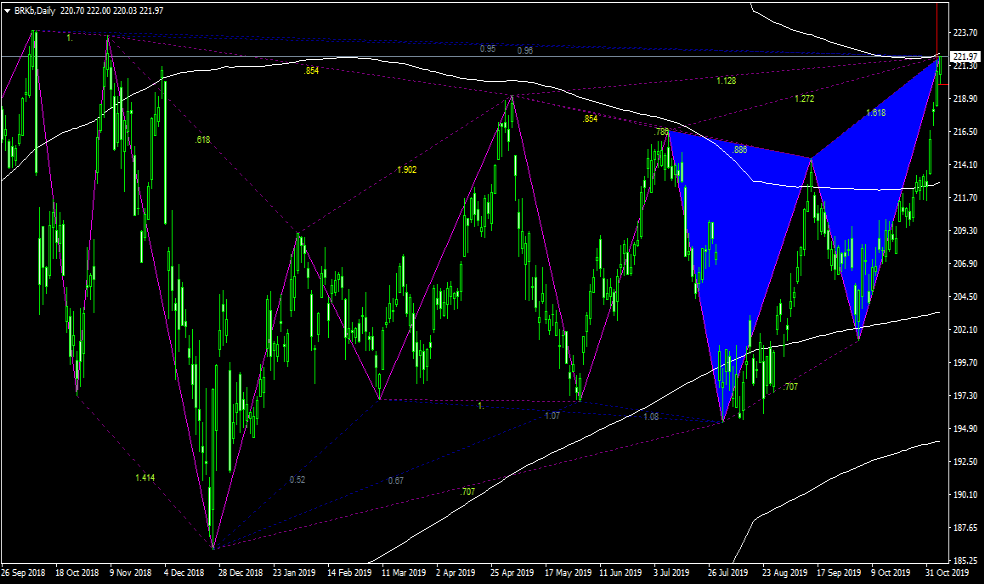
- You can look at ZUP for a butterfly (not required)
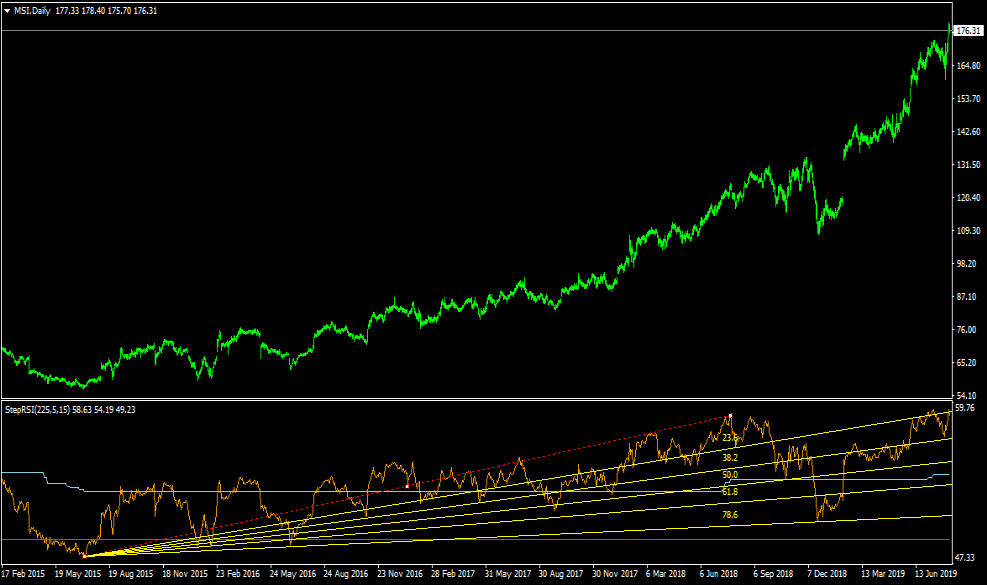
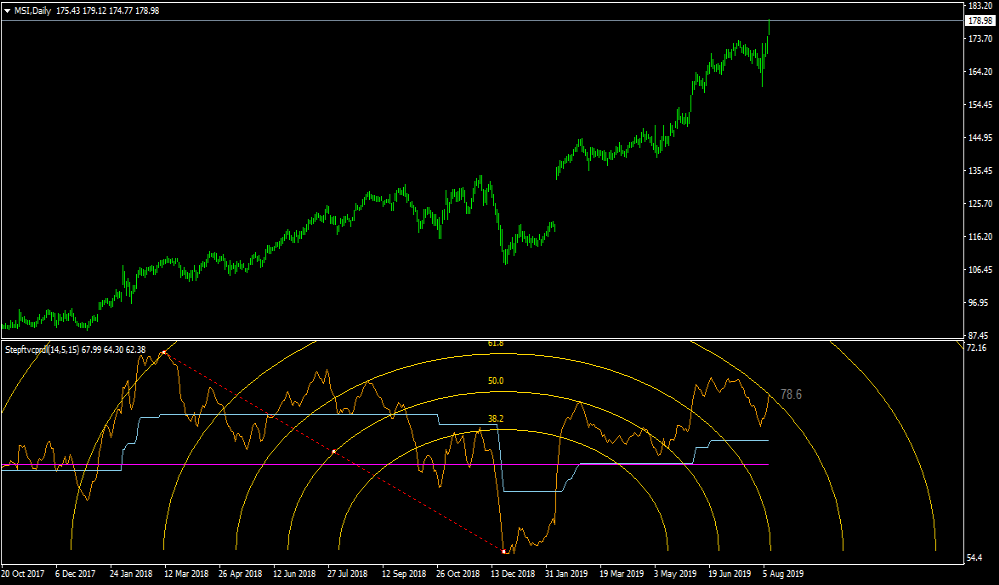
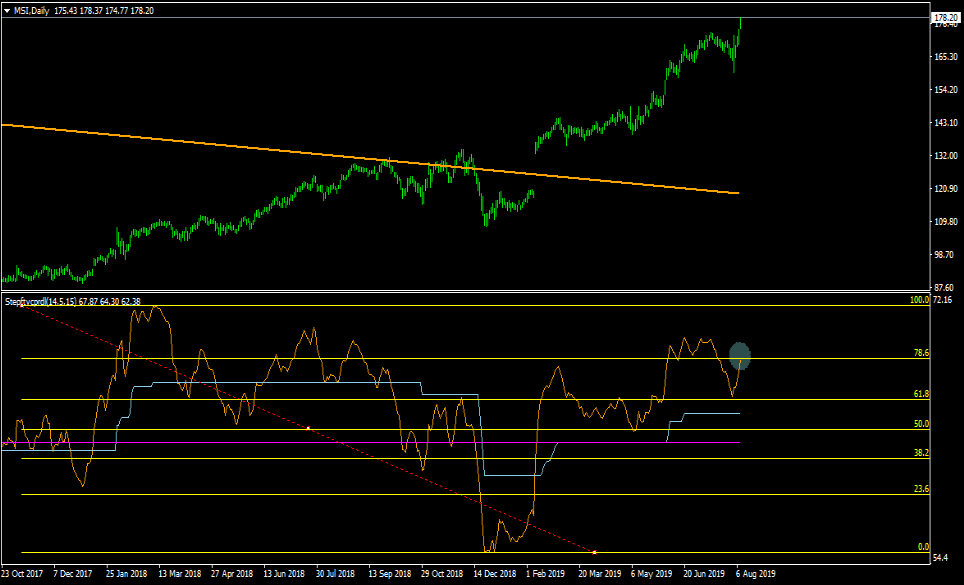
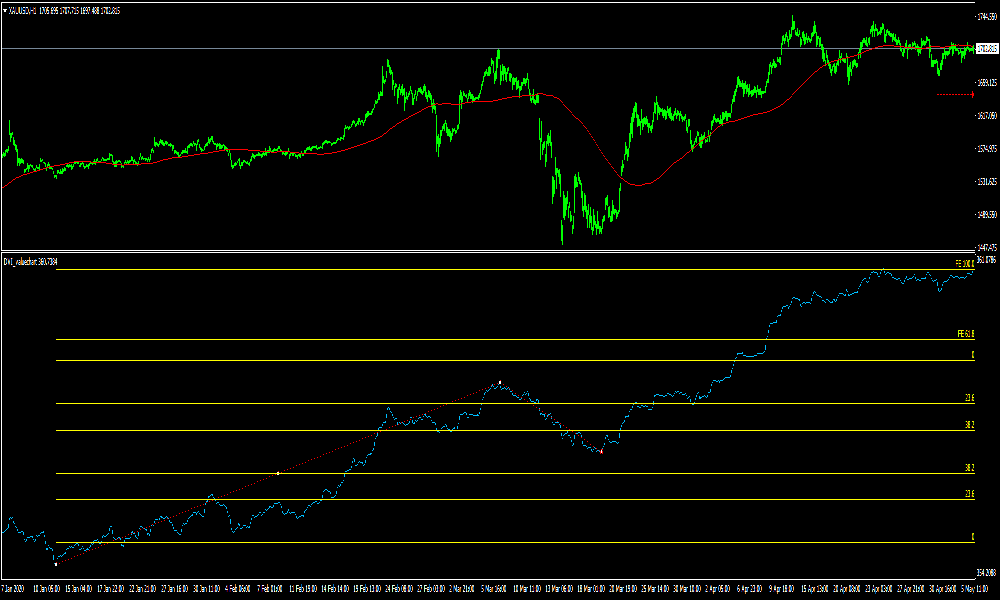
- Finally you can use StepRSI 225 and Stepftvcprdl with Fibonacci fans, Fibonacci retracements,
Pitchforks, and Fibonacci arcs on 1 hour to daily charts like that: (not required)
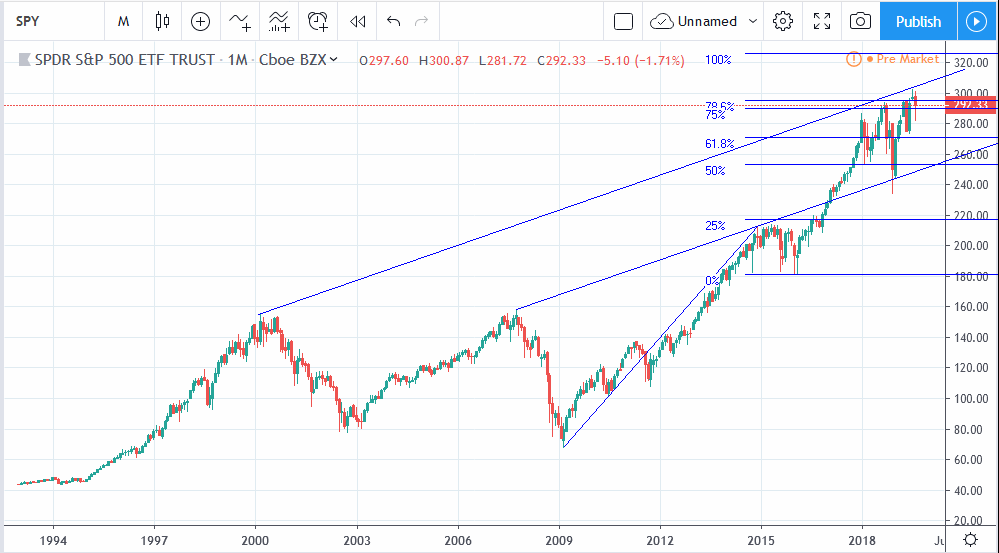
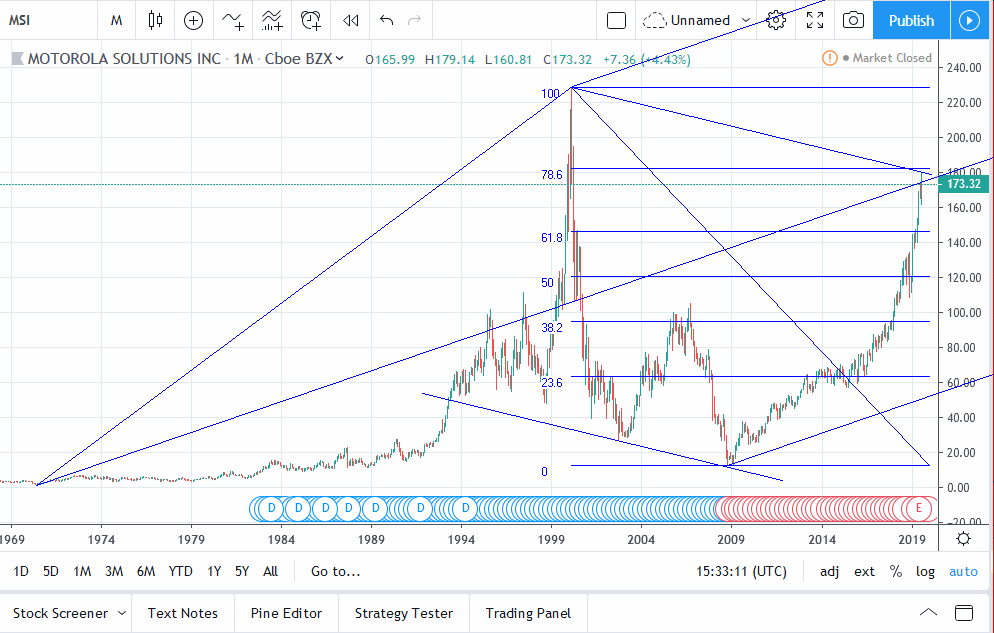
- tradingview.com has the best historical data. It's recommended to use it for long term view of the
market. Here it is on Monthly charts: (not required)
- DVI_VALUECHART with Fibo expansions (not required)
- With the Directional Volume Index indicator :
gold line must be > 0 and distant from 0 if we sell or
gold line must be < 0 and distant from 0 if we buy
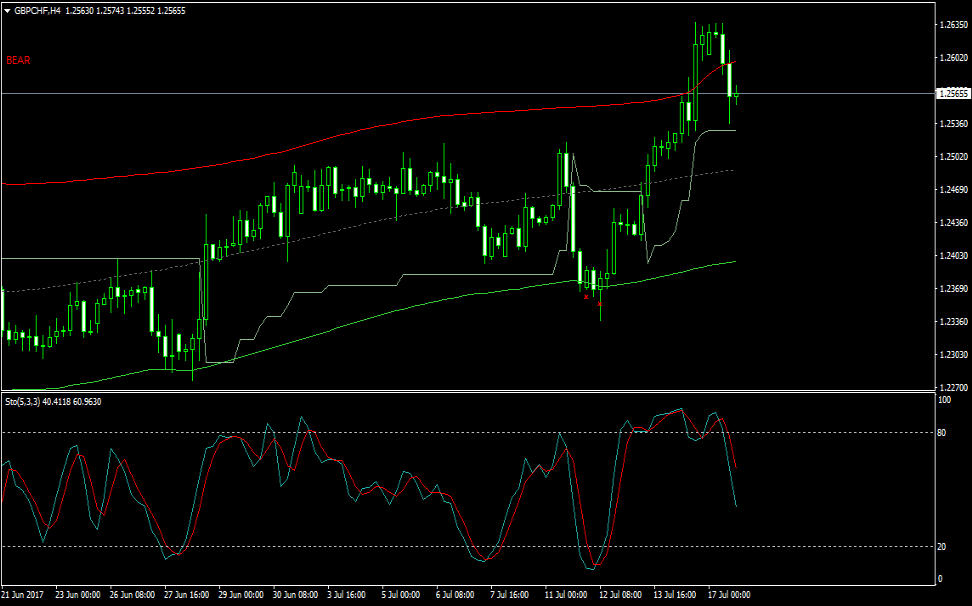
Exit (Target Point) (please use H1 timeframe instead of H4):
With template 0tmacg:
- price reachs the Volatility.Pivot gray line
or
- stochastic 5,3,3 is near 20
or
- price reachs the Tma+CG middle dot line
Do not hesitate to use the PeriodConverter in MT4 Scripts if your TP becomes negative.