- TD Sequential is >=13 on Daily timeframe
- Price is near BB - HL Lower / Higher band on Daily timeframe
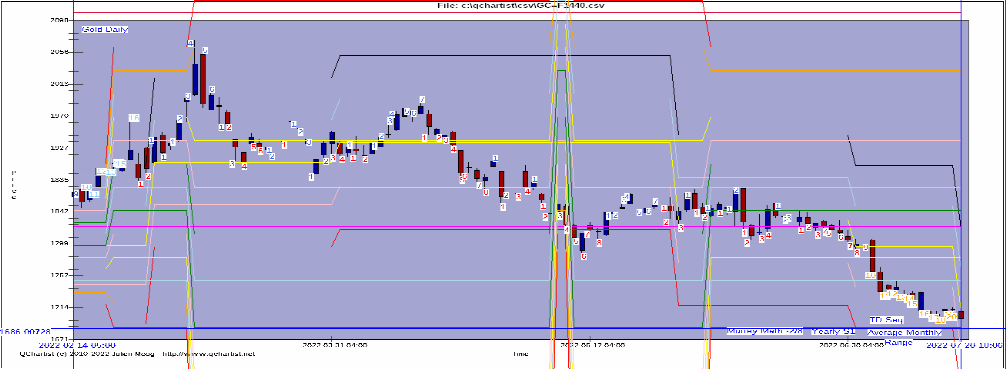
- Murrey Math on Daily timeframe is at least on the orange line + - 1/8
- Yearly Pivot Points indicator max/min
- Average Monthly Range indicator max/min
- Astro on Daily timeframe:
- Price bounce on Jupiter - Saturn Cycle
or
- Price bounce on PlanetSQN Chap 15
or
- Price bounce on Planet_Scale
- On Monthly timeframe:
- Use price action with Drawing tools (Fibo Fans or Fibo Rets or Ellipse or Pitchforks or
Grids or Speed Resistance Lines)
and
- Use price action with Drawing tools that require the "Lock Price Time Scale relationship"
(Modify Axis Type to Fixed and set the Lock Price Scale Ratio value according to the number
of Displayed Bars. Then you can use Square or Triangle or Circle or Pentagram or Square
from Center or Triangle from Center or Fibo Arcs (modify settings) or Seed of Life or Fibo
Circles)
Exit (Target Point) (Hourly timeframe):
- price reachs the Volatility.Pivot gray line
or
- stochastic 5,3,3 is near 20 or 80
or
- price reachs the Tma+CG middle dot line