StepFTVCPRDL_v2 can be used for many purposes :
- to know the trend :
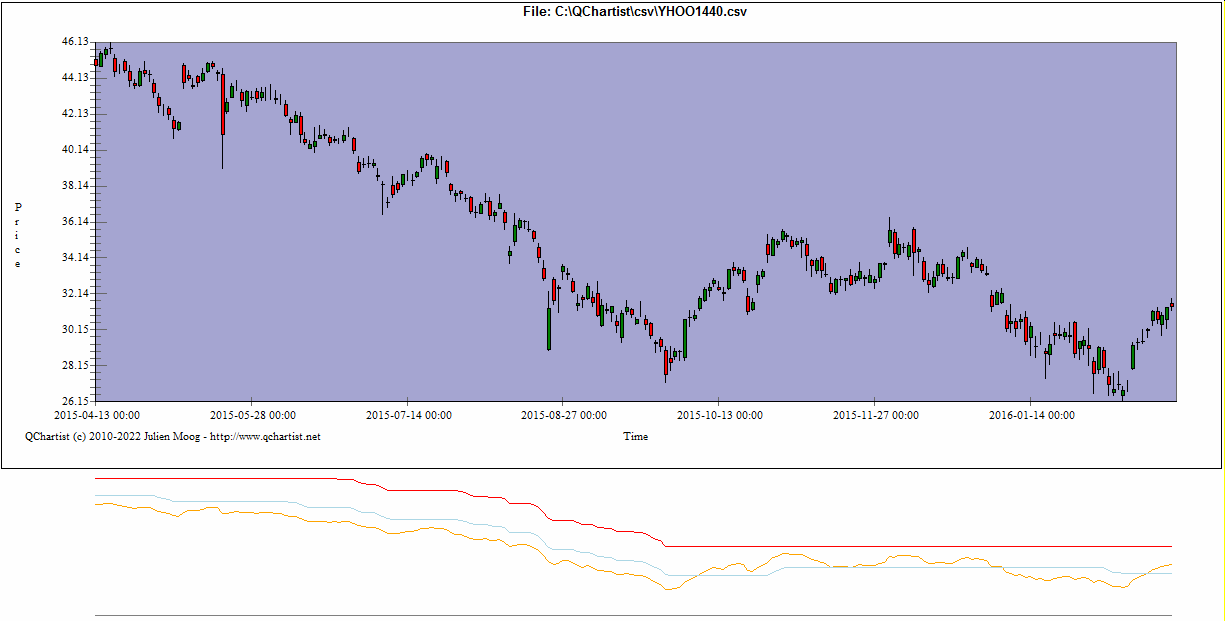
when the cyan line is above the magenta line = up trend
when the cyan line is below the magenta line = down trend
- to know when the price will bounce :
you will notice that the orange line often bounce on the cyan and magenta
lines
- to know when the market is overbought/oversold
when all the 3 lines are <= 20 = strongly oversold
when all the 3 lines are >= 80 = strongly overbought
- it also gives great signals with Fibo fans or Andrew pitchforks
Try it, you will love it !