Moving Average Convergence/Divergence (MACD) is the next trend-following
dynamic indicator. It indicates the correlation between two Moving Averages
of a price.
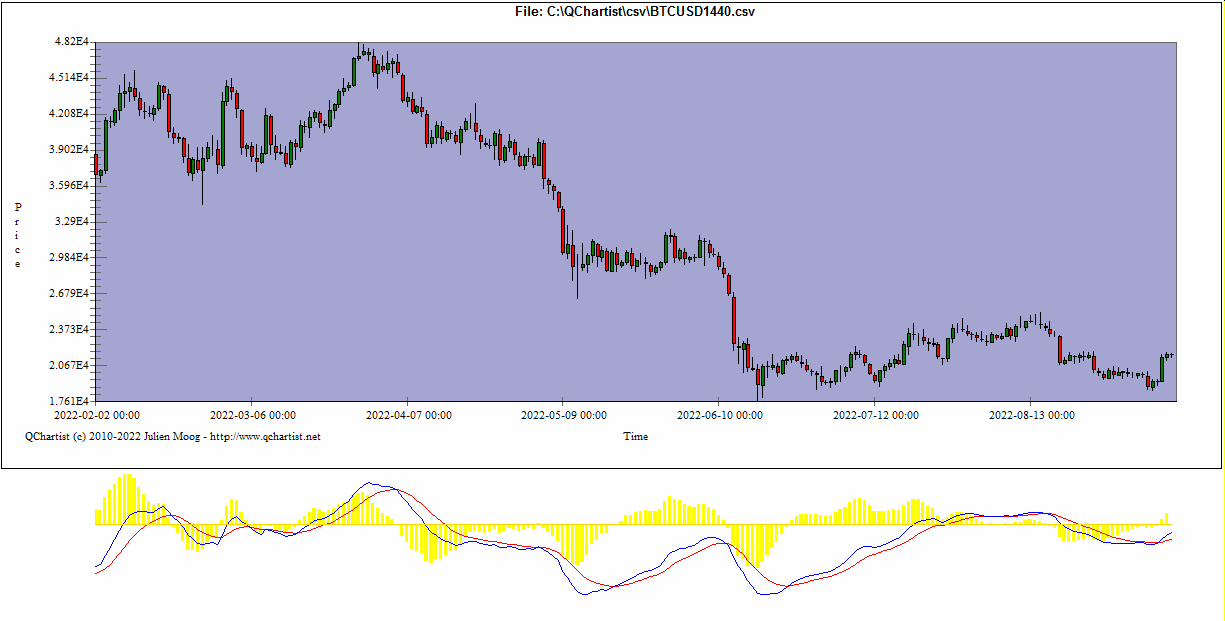
The Moving Average Convergence/Divergence (MACD) Technical Indicator is
the difference between a 26-period and 12-period exponential moving
averages (EMA).
The MACD proves most effective in wide-swinging trading markets.
When the blue MACD line is almost as high as the yellow histogram line (or
blue >= yellow line), this is a sell signal.
When the blue MACD line is almost as low as the yellow histogram line (or
blue <= yellow line), this is a buy signal.