Money Flow Index
Money Flow Index (MFI) is the technical indicator, which indicates the rate at
which money is invested into a security and then withdrawn from it.
Construction and interpretation of the indicator is similar to Relative Strength
Index with the only difference that volume is important to MFI.
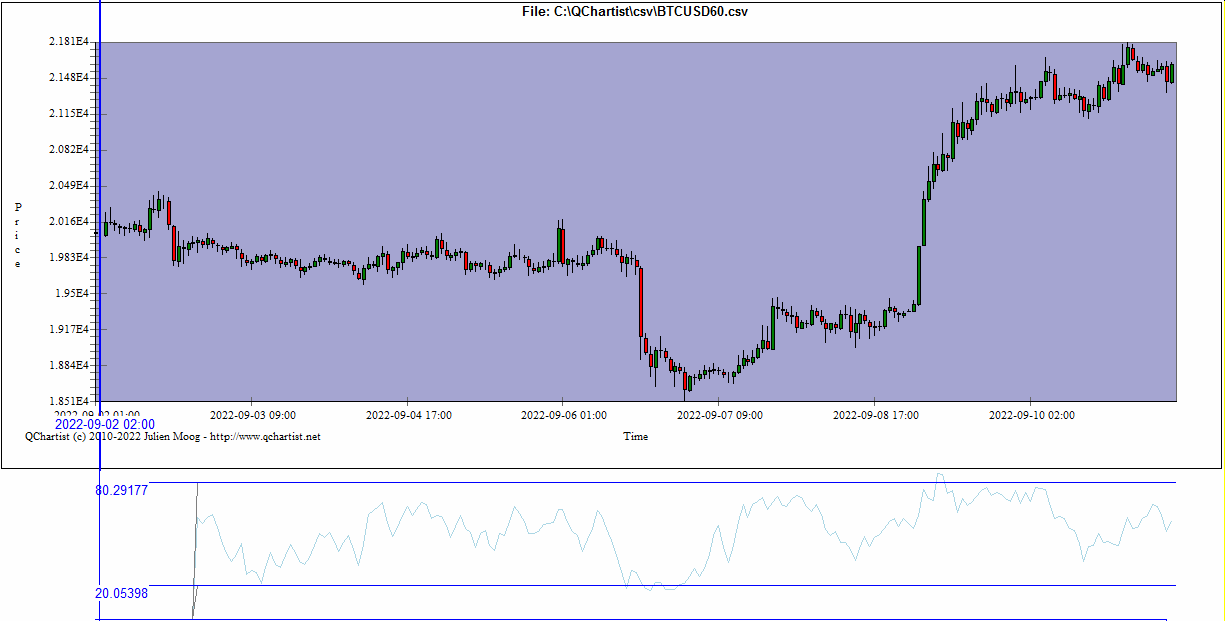
When analyzing the money flow index one needs to take into consideration
the following points:
- divergences between the indicator and price movement. If prices grow
while MFI falls (or vice versa), there is a great probability of a price
turn;
- Money Flow Index value, which is over 80 or under 20, signals
correspondingly of a potential peak or bottom of the market.
CalculationThe calculation of Money Flow Index includes several stages. At first one
defines the typical price (TP) of the period in question.
TP = (HIGH + LOW + CLOSE)/3
Then one calculates the amount of the Money Flow (MF):
MF = TP * VOLUME
If today’s typical price is larger than yesterday’s TP, then the money flow is
considered positive. If today’s typical price is lower than that of yesterday, the
money flow is considered negative.
A positive money flow is a sum of positive money flows for a selected period
of time. A negative money flow is the sum of negative money flows for a
selected period of time.
Then one calculates the money ratio (MR) by dividing the positive money flow
by the negative money flow:
MR = Positive Money Flow (PMF)/Negative Money Flow (NMF)
And finally, one calculates the money flow index using the money ratio:
MFI = 100 - (100 / (1 + MR))