If the price is above the cloud, its upper line forms the first support level, and
the second line forms the second support level ;
If the price is below cloud, the lower line forms the first resistance level, and
the upper one forms the second level ;
If the Chikou Span line traverses the price chart in the bottom-up direction it is
signal to buy. If the Chikou Span line traverses the price chart in the top-down
direction it is signal to sell.
Kijun-sen is used as an indicator of the market movement. If the price is
higher than this indicator, the prices will probably continue to increase. When
the price traverses this line the further trend changing is possible. Another
kind of using the Kijun-sen is giving signals. Signal to buy is generated when
the Tenkan-sen line traverses the Kijun-sen in the bottom-up direction. Top-
down direction is the signal to sell. Tenkan-sen is used as an indicator of the
market trend. If this line increases or decreases, the trend exists. When it
goes horizontally, it means that the market has come into the channel.
Always Start With the Cloud
The cloud is composed of two dynamic lines that are meant to serve multiple
functions. However, the primary purpose of the cloud is to help you identify
the trend of current price in relation to past price action. Given that protecting
your capital is the main battle every trader must face, the cloud helps you to
place stops and recognize when you should be bullish or bearish. Many
traders will focus on candlesticks or price action analysis around the cloud to
see if a decisive reversal or continuation pattern is taking shape.
Market's sentiment:
Kumo is dictated by two instruments: Senkou Span A and Span B Senkou
position, one above the other can give us valuable information about the
general tone of the market, the possible vulnerabilities in a trend or correction
or of sudden change in trend. It become bearish when Senkou Span A
crosses bellow the Senkou Span B, as you observe that is a high probability
changing in trend's direction, although nothing is announcing that the possible
decline.
Kumo's may report and delimitation of the range, flat tops or flat bottoms (a
highly resistances and support zones), almost horizontal lines drawn by
Spain's Senkou or Senkou Span B.
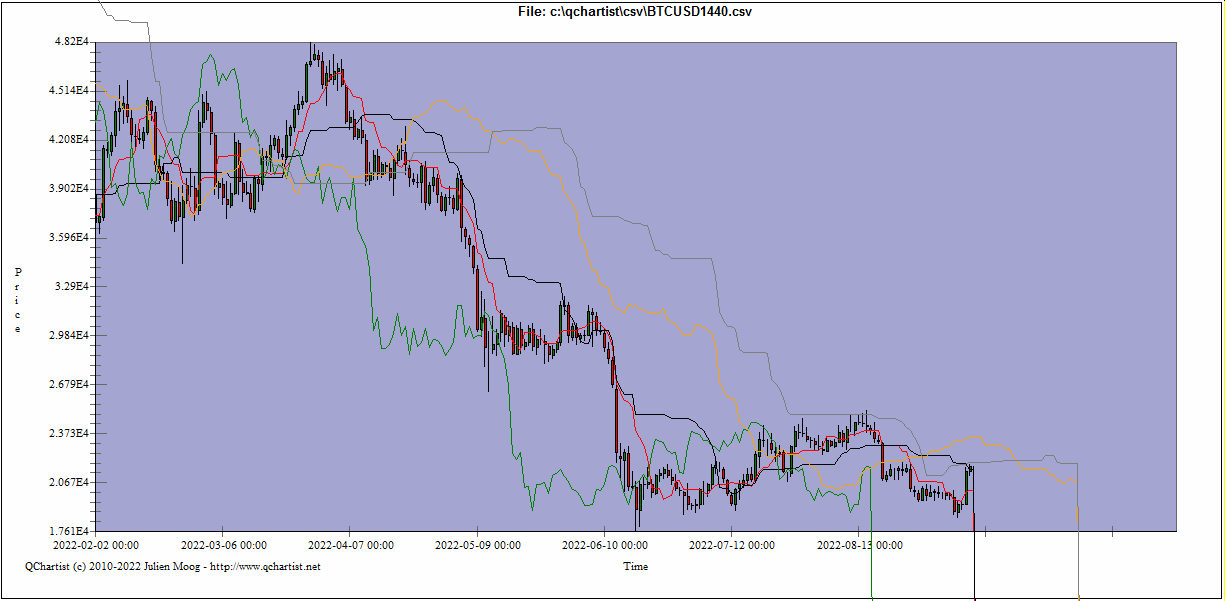
Ichimoku Kinko Hyo
Ichimoku Kinko Hyo Technical Indicator is predefined to characterize the market
Trend, Support and Resistance Levels, and to generate signals of buying and selling.
This indicator works best at weekly and daily charts.
When defining the dimension of parameters, four time intervals of different length are
used. The values of individual lines composing this indicator are based on these
intervals:
- Tenkan-sen shows the average price value during the first time interval
defined as the sum of maximum and minimum within this time, divided by
two;
- Kijun-sen shows the average price value during the second time interval;
- Senkou Span A shows the middle of the distance between two previous lines
shifted forwards by the value of the second time interval;
- Senkou Span B shows the average price value during the third time interval
shifted forwards by the value of the second time interval.
Chinkou Span shows the closing price of the current candle shifted backwards by the
value of the second time interval. The distance between the Senkou lines is hatched
with another color and called "cloud". If the price is between these lines, the market
should be considered as non-trend, and then the cloud margins form the support and
resistance levels. If the price is above the cloud, its upper line forms the first support level, and
the second line forms the second support level;
If the price is below cloud, the lower line forms the first resistance level, and
the upper one forms the second level;If the Chinkou Span line traverses the price chart in the bottom-up direction it
is signal to buy. If the Chinkou Span line traverses the price chart in the top-
down direction it is signal to sell.Kijun-sen is used as an indicator of the market movement. If the price is higher than
this indicator, the prices will probably continue to increase. When the price traverses
this line the further trend changing is possible. Another kind of using the Kijun-sen is
giving signals. Signal to buy is generated when the Tenkan-sen line traverses the
Kijun-sen in the bottom-up direction. Top-down direction is the signal to sell.
Tenkan-sen is used as an indicator of the market trend. If this line increases or
decreases, the trend exists. When it goes horizontally, it means that the market has
come into the channel.