The principle of Elliott Waves is a concept on the development of the financial
markets suggested by Ralph Nelson Elliott (1871/1948). It is directly inspired
from the Dow theory. The fundation of this theory is that the evolution of
markets is done by a series of successive waves, and this, what ever is the
scale of observation of this market (from the minute to the long term). We
speak then of a fractal process.
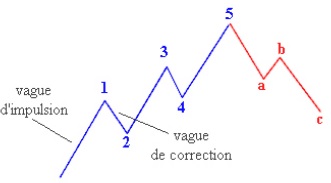
First element:
The complete movement is composed of 5 waves. 3 of these waves are in the
direction of the movement, and 2 waves are in the opposite direction.
The first, third and fifth wave are impulsive ; the second and fourth are
corrective.
Second element:
The five waves of a dimension become just one wave of a superior
dimension. Inversely, one wave of a dimension is composed of 5 sub waves
of an inferior dimension.
Third element:
Each impulsive wave (1-3-5) is composed of 5 sub waves, whereas each
corrective wave (2-4) is composed of 3 sub waves.
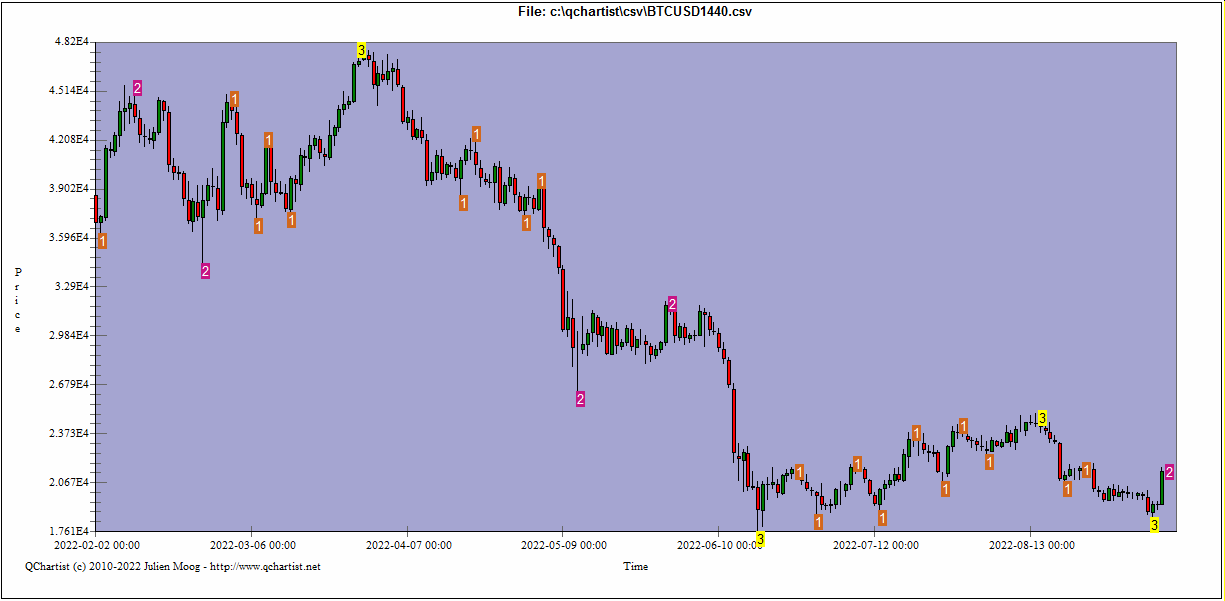
The indicator calculates these waves and suggests that each time that the
number "3" appears on the chart, there is the highest probability that there is
a trend reversal soon.
This indicator is very efficient and helps a lot to reinforce the probability of a
good signal.